


The three panels
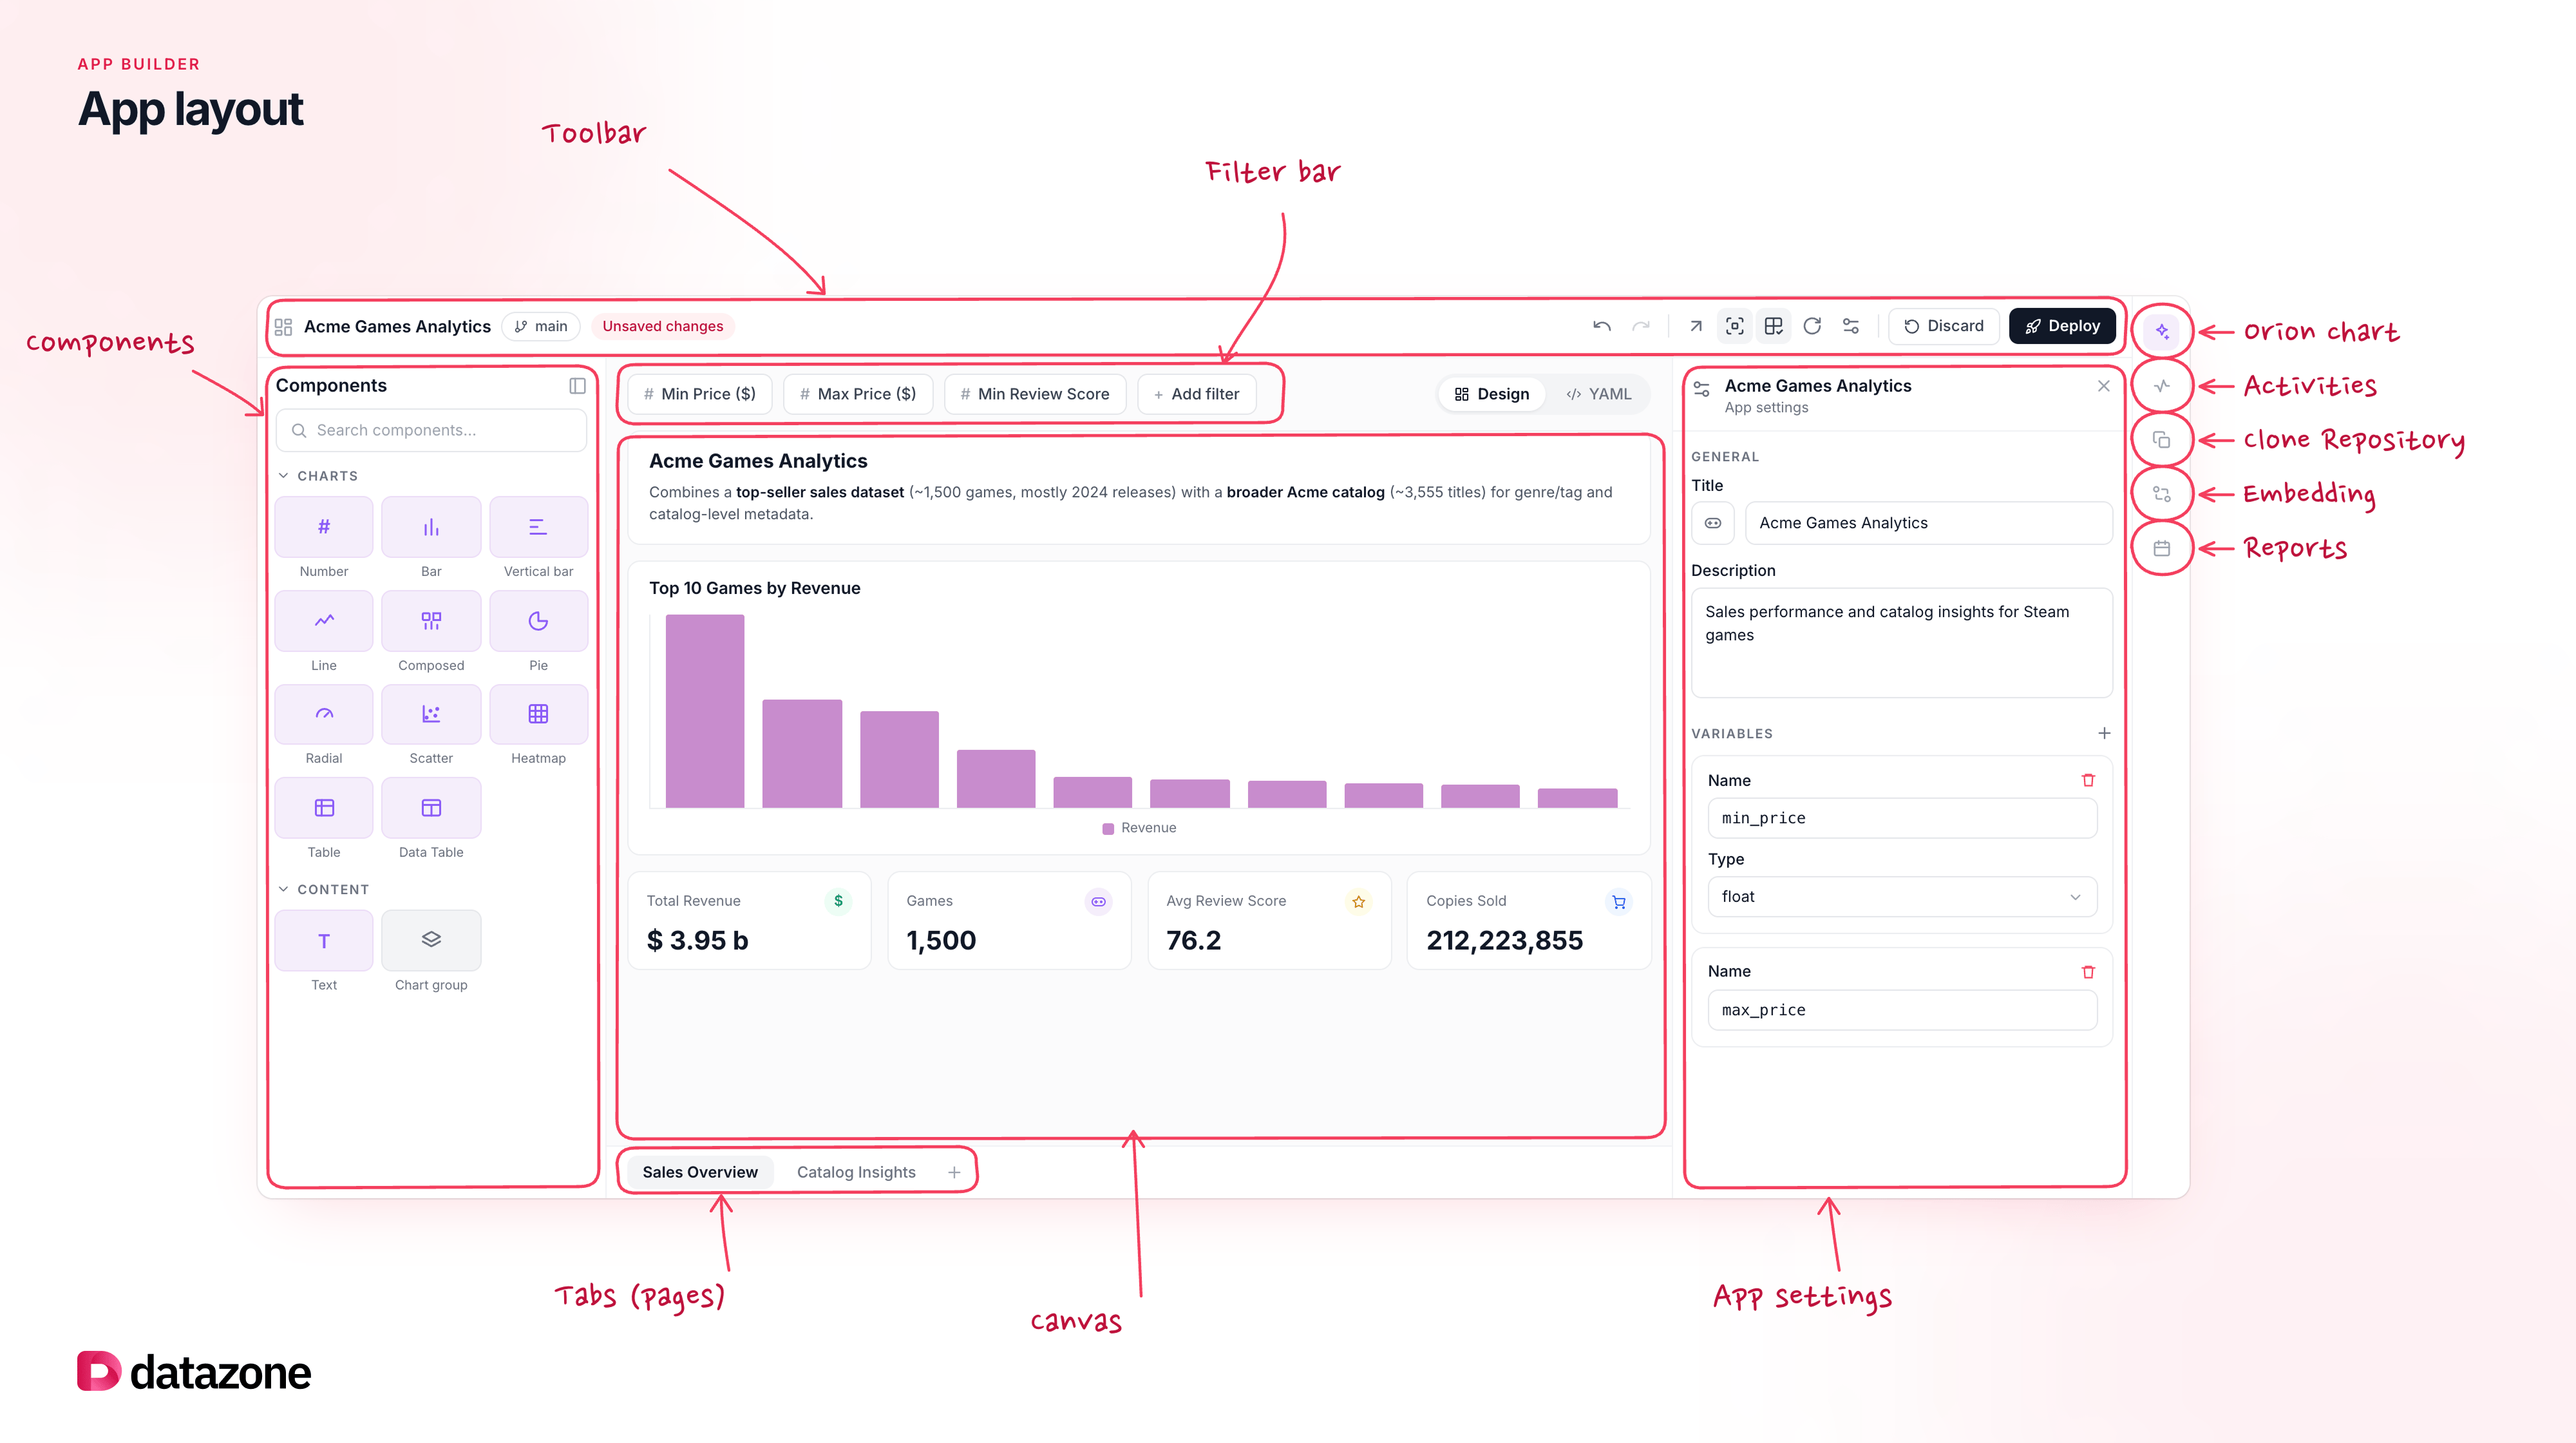
- Palette (left): every component type you can drop onto a page — chart types (bar, line, pie, number, composed, radial, scatter, heatmap, table, and more), filter types (dropdown, text, number, date), and a text block. Drag from here onto the canvas.
- Canvas (center): a live preview of the active page. Components are placed, moved, grouped, and resized here. Page tabs sit above the canvas — an app can have any number of pages, added with the + button, reordered by dragging, and renamed by double-clicking a tab’s label. The delete-tab button is hidden while only one page remains, so an app can never end up with zero pages.
- Inspector (right): every setting for whatever is selected on the canvas — chart type, query, dimensions/metrics, visual options (color, labels, size), filter bindings. With nothing selected, it prompts you to pick something — or, once you open App Settings from the toolbar, it shows app-wide settings instead.
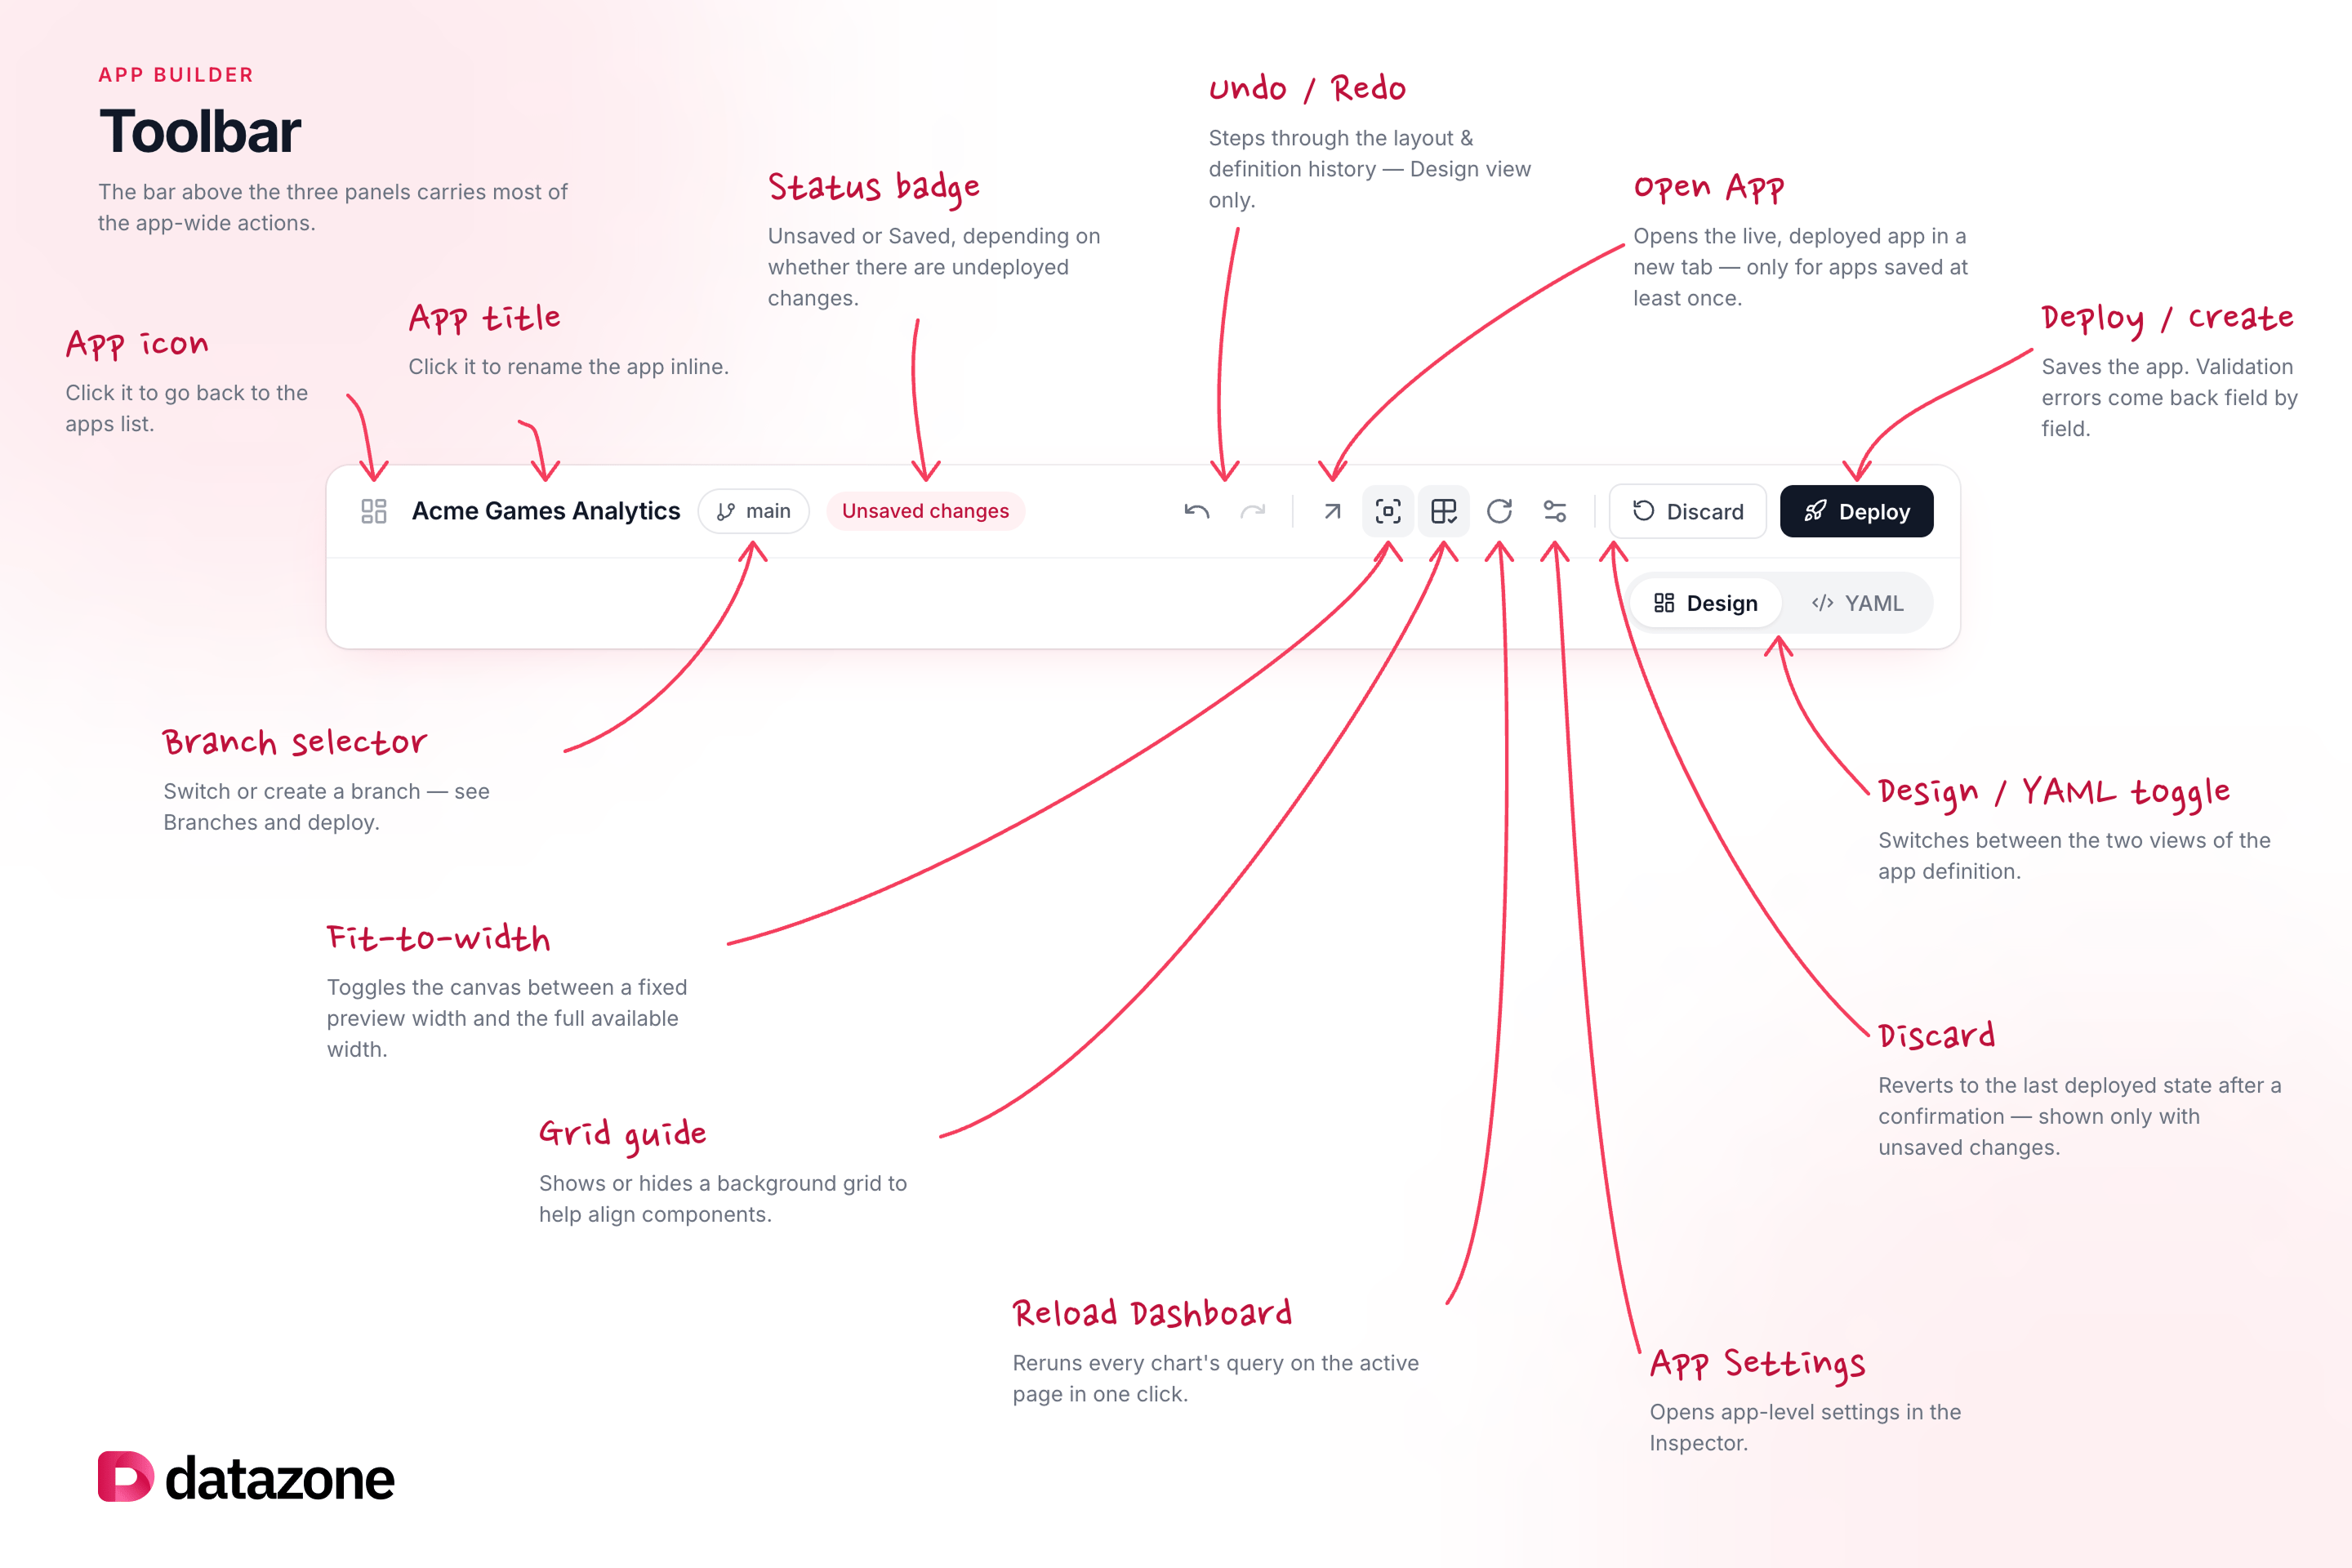
Toolbar
Side rail
Next to the Inspector, a vertical rail of icons switches what the right side of the screen shows:App-level settings
Opening App Settings from the toolbar’s gear icon — or the Inspector when nothing is selected on the canvas — brings up settings for the app as a whole:
These map to the
config fields described in Intelligent Apps: App Configuration — this panel is a form over the same YAML.
Components
The Palette covers four kinds of building block:
Each chart type has its own required fields and
chart_config options, and the Inspector only shows what applies to the selected type — a Pie chart exposes show_labels/fill_donut/show_legend, a Table exposes page_size, and so on.
Layout and interactions
Drag and drop: drag a component from the Palette onto the canvas, then reorder or move it within the page. You can also click a Palette card to add it directly, instead of dragging.- Multi-select: select several components at once to move, reload, group, or delete them together.
- Right-click menu: select, duplicate, reload data, group, or delete a component (or the current multi-selection) from its context menu.
- Duplicate: copy a chart, text block, or group — available from its context menu or the Inspector.
- Undo/Redo: every layout and definition change can be undone or redone.
- Unsaved changes: any edit puts the app into an “unsaved” state until you Deploy — nothing is persisted before that. Discard in the toolbar reverts everything back to the last deployed state.
Building with Orion
Orion isn’t only for asking questions about a finished app — inside the App Builder, it can edit the app for you. There are two ways to use it while designing:- The Orion chat panel — a general-purpose panel where you describe a change in plain language (“add a filter,” “turn this chart into a bar chart,” “create a new page”). Orion produces patches to the app definition, applied live to the canvas as it works.
- “Add chart with Orion” — an inline popover under the canvas, focused specifically on creating or editing a single chart. The change is applied immediately so you can see it rendered against real data, then you choose Keep or Revert.
- Generate query with AI — inside a chart’s query field in the Inspector, a smaller, scoped version of the same idea: describe what the query should return and Orion writes just the SQL, without touching the rest of the chart’s configuration.
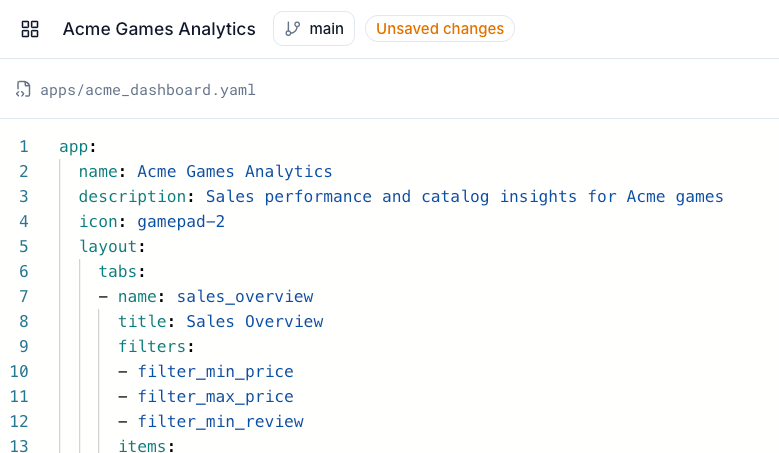
YAML view
Branches and deploy
Apps are held in git-like branches:- Switching branches: pick an existing branch from the toolbar’s branch selector. With unsaved changes, a confirmation dialog offers Discard and switch or Deploy and switch.
- Creating a branch: the source branch (the currently active one) is shown as a fixed label; you enter a name for the new branch. A name that’s already in use is rejected. Unsaved changes at creation time trigger the same Discard and create / Deploy and create choice. Creating a branch automatically deploys the current app definition onto it (a git-level copy).
- Deploy: makes every change on the active branch permanent. The definition has to pass backend validation first — an invalid definition can’t be deployed, and you get an error message back.
- Deleting a branch: removes it from the branch selector along with the app version deployed on it.
- Switching straight to a newly created branch may briefly show a loading state while the backend finishes indexing it; the app retries a few times, and if the branch genuinely can’t be found, you’re redirected back with a toast notification.
Good to know
- When Orion applies several patches at once, a new chart has to land in both
componentsandlayoutconsistently. If those two get out of sync, the chart can still render on the canvas while the Inspector or a subsequent deploy runs into trouble. - The fields the backend accepts (like
chart_configoptions) depend on the chart type. A field the Inspector doesn’t surface for a given type can still be required by the backend schema.
Next steps
- Components — every chart type and its configuration
- Filters — connecting filters to charts
- Orion AI — asking Orion about a deployed app
- YAML Reference — the full app definition schema
- Embedding — embedding a deployed app elsewhere
- Reports — scheduling snapshots of an app via Slack or email