> ## Documentation Index
> Fetch the complete documentation index at: https://docs.datazone.co/llms.txt
> Use this file to discover all available pages before exploring further.
# Overview
> Build interactive data applications with Datazone's Intelligent Apps feature
# Intelligent Apps
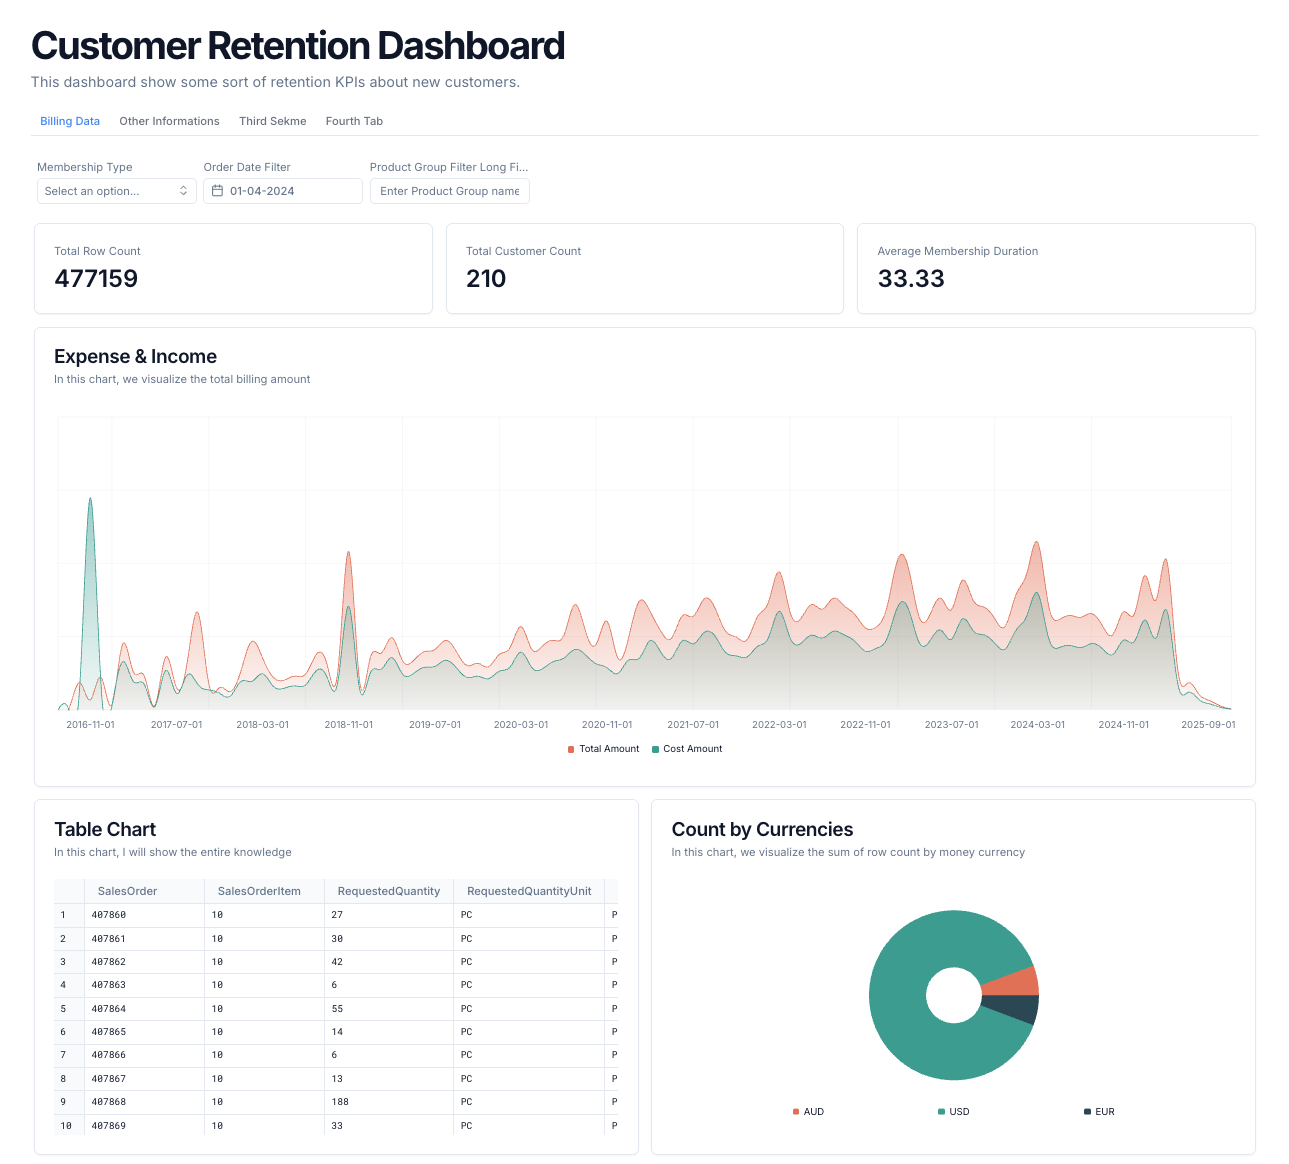
Datazone Intelligent Apps provide a powerful way to build interactive data dashboards and applications without writing frontend code. Using a declarative YAML configuration, you can create multi-tab dashboards with charts, filters, and interactive elements that query your data directly.
## Overview
An Intelligent App consists of:
1. **Layout** - How your application is organized (tabs, charts, groups)
2. **Components** - The building blocks of your app (charts, filters, variables)
3. **Configuration** - Settings that control app behavior
 ## App Structure
Intelligent Apps use a YAML-based configuration format:
```yaml theme={null}
app:
name: "My Dashboard"
description: "Dashboard description"
config:
cache: true
cache_ttl: 3600
hide_llm: false # (Optional) Hide the LLM assistant (Orion AI) in the app UI
hide_insights: false # (Optional) Hide the Insights panel in the app UI
llm_instruction: "You are a helpful assistant." # (Optional) Custom LLM instruction
layout:
tabs:
- name: main_tab
title: "Main Dashboard"
filters: [...]
items: [...]
components:
charts: [...]
variables: [...]
filters: [...]
```
## Key Components
### Charts
Charts are the primary visualization elements. Datazone supports several chart types:
| Chart Type | Description |
| ------------ | --------------------------- |
| `number` | Single metric display |
| `line` | Time-series/trend chart |
| `bar` | Categorical comparisons |
| `pie` | Part-to-whole relationships |
| `radial` | Radial gauge for metrics |
| `table` | Tabular data display |
| `data_table` | Advanced tabular display |
Example chart definition:
```yaml theme={null}
- type: line
name: sales_over_time
title: "Sales Over Time"
description: "Monthly sales trend"
query: |
SELECT
toStartOfMonth(order_date) AS month,
sum(amount) AS total_amount
FROM orders
GROUP BY month
ORDER BY month
dimensions:
- name: month
label: Month
metrics:
- name: total_amount
label: Total Sales
format: "$0,0.00"
```
Example number chart definition:
```yaml theme={null}
- type: number
name: completed_tasks
title: "Completed Tasks"
query: "SELECT count(*) as completed FROM tasks WHERE status = 'done'"
metrics:
- name: completed
label: Completed Tasks
icon: check
icon_variant: success
format: "0"
```
#### Dimension Properties
| Property | Type | Description |
| --------------- | ------ | --------------------------------------------- |
| `name` | string | Unique identifier for the dimension |
| `label` | string | Display label for the dimension |
| `number_format` | string | (Optional) Number format for this dimension |
| `table_align` | string | (Optional) Table alignment: `left` or `right` |
### Layout
The layout defines how components are arranged in your app using a responsive grid system:
* **Tabs**: Organize content into different sections
* **Items**: Individual elements like charts or text
* **Chart Groups**: Collections of related charts
* **Span/Height**: Control sizing and layout
## App Structure
Intelligent Apps use a YAML-based configuration format:
```yaml theme={null}
app:
name: "My Dashboard"
description: "Dashboard description"
config:
cache: true
cache_ttl: 3600
hide_llm: false # (Optional) Hide the LLM assistant (Orion AI) in the app UI
hide_insights: false # (Optional) Hide the Insights panel in the app UI
llm_instruction: "You are a helpful assistant." # (Optional) Custom LLM instruction
layout:
tabs:
- name: main_tab
title: "Main Dashboard"
filters: [...]
items: [...]
components:
charts: [...]
variables: [...]
filters: [...]
```
## Key Components
### Charts
Charts are the primary visualization elements. Datazone supports several chart types:
| Chart Type | Description |
| ------------ | --------------------------- |
| `number` | Single metric display |
| `line` | Time-series/trend chart |
| `bar` | Categorical comparisons |
| `pie` | Part-to-whole relationships |
| `radial` | Radial gauge for metrics |
| `table` | Tabular data display |
| `data_table` | Advanced tabular display |
Example chart definition:
```yaml theme={null}
- type: line
name: sales_over_time
title: "Sales Over Time"
description: "Monthly sales trend"
query: |
SELECT
toStartOfMonth(order_date) AS month,
sum(amount) AS total_amount
FROM orders
GROUP BY month
ORDER BY month
dimensions:
- name: month
label: Month
metrics:
- name: total_amount
label: Total Sales
format: "$0,0.00"
```
Example number chart definition:
```yaml theme={null}
- type: number
name: completed_tasks
title: "Completed Tasks"
query: "SELECT count(*) as completed FROM tasks WHERE status = 'done'"
metrics:
- name: completed
label: Completed Tasks
icon: check
icon_variant: success
format: "0"
```
#### Dimension Properties
| Property | Type | Description |
| --------------- | ------ | --------------------------------------------- |
| `name` | string | Unique identifier for the dimension |
| `label` | string | Display label for the dimension |
| `number_format` | string | (Optional) Number format for this dimension |
| `table_align` | string | (Optional) Table alignment: `left` or `right` |
### Layout
The layout defines how components are arranged in your app using a responsive grid system:
* **Tabs**: Organize content into different sections
* **Items**: Individual elements like charts or text
* **Chart Groups**: Collections of related charts
* **Span/Height**: Control sizing and layout
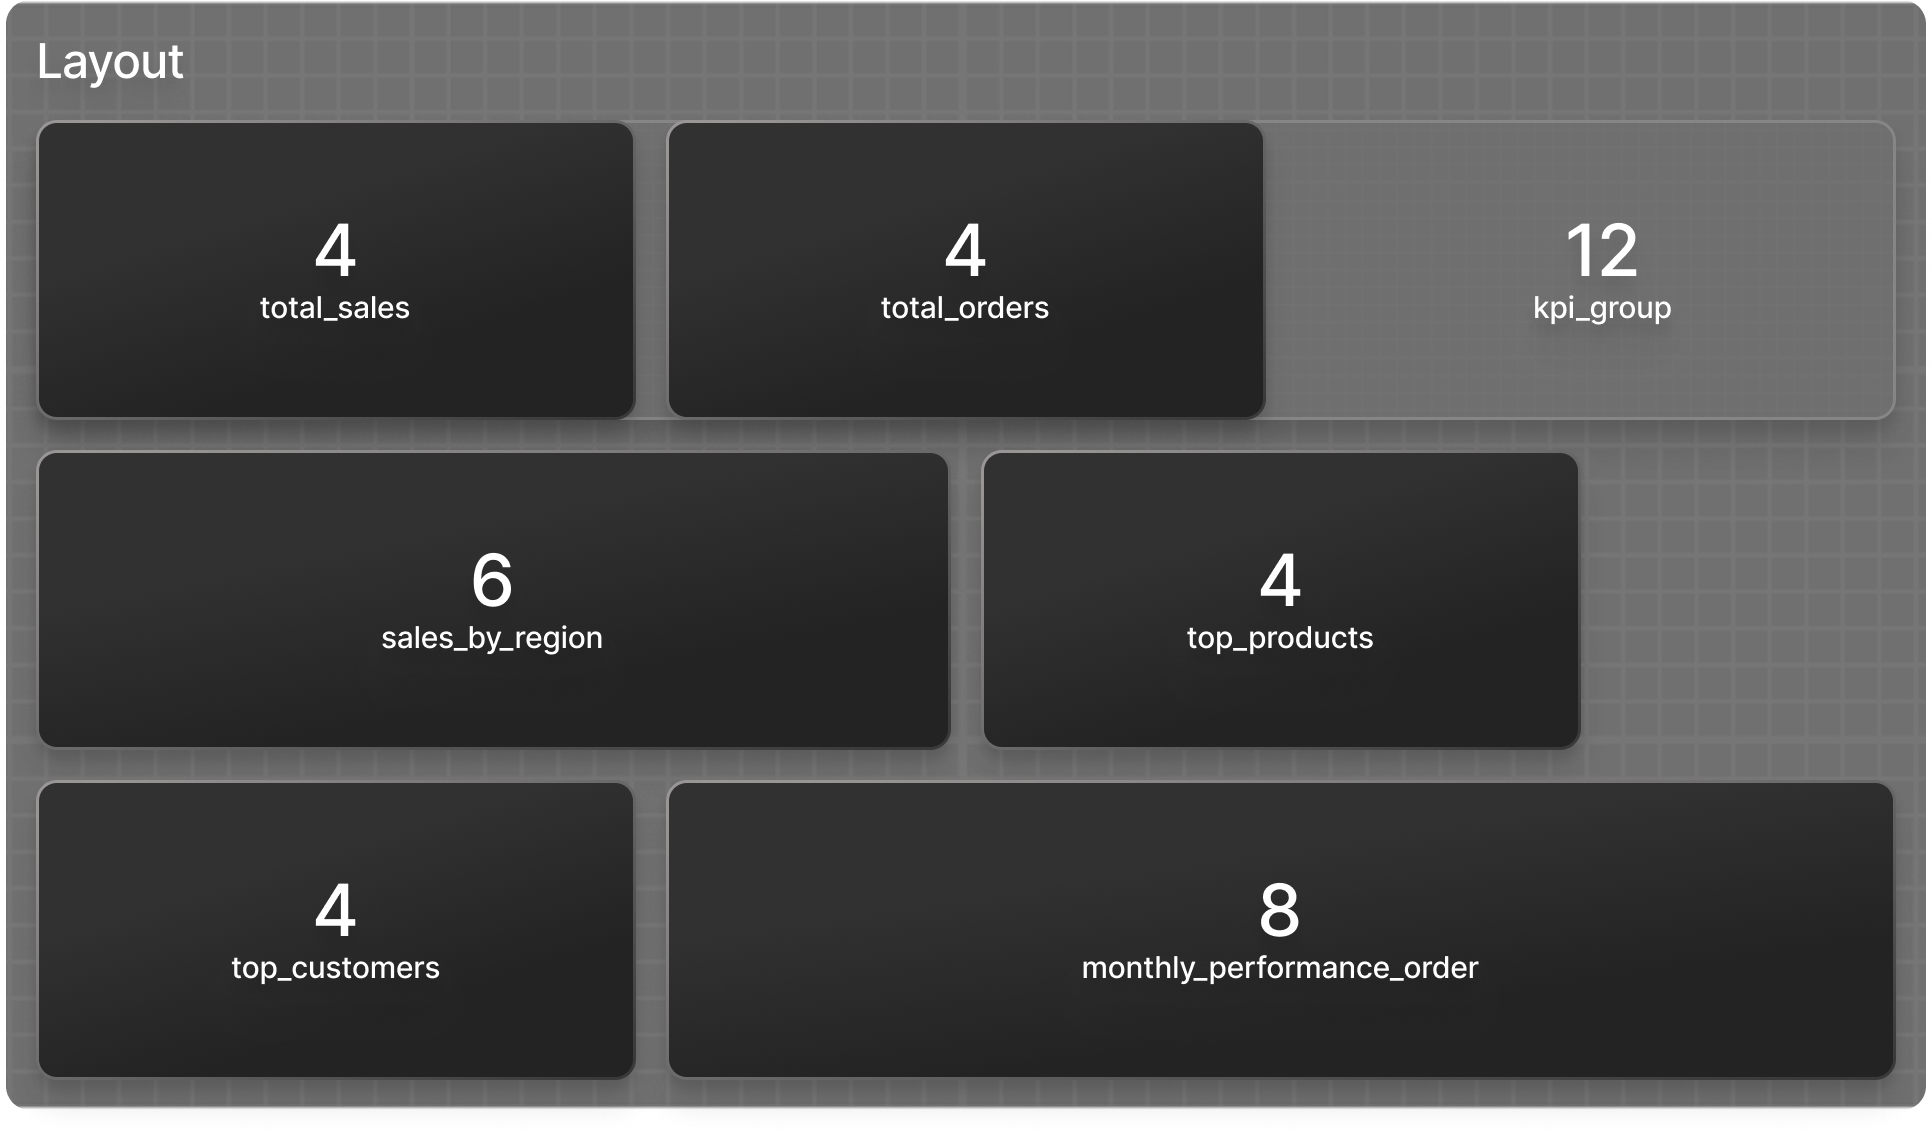 Example layout:
```yaml theme={null}
layout:
tabs:
- name: overview
title: "Overview"
filters: ["start_date", "product_category"]
items:
- type: chart-group
name: kpi_group
span: 12
entities:
- type: chart
name: total_sales
span: 4
- type: chart
name: total_orders
span: 4
- type: chart
name: sales_by_region
height: 400
span: 6
- type: chart
name: top_products
height: 400
span: 4
- type: chart
name: top_customers
height: 400
span: 4
- type: chart
name: monthly_performance_order
height: 400
span: 8
```
### Interactivity
Make your apps interactive with variables and filters:
* **Variables**: Store values that can be used in queries
* **Filters**: UI elements that update variables
Example filter:
```yaml theme={null}
filters:
- type: dropdown
name: category_filter
title: "Product Category"
affected_variable: product_category
options:
type: sql
query: "SELECT DISTINCT category FROM products"
```
## Query Variables
You can reference variables in your queries using double curly braces:
```yaml theme={null}
query: |
SELECT * FROM orders
WHERE order_date > '{{ start_date }}'
AND order_date < '{{ end_date }}'
{% if product_category != 'all' %}
AND category = '{{ product_category }}'
{% endif %}
```
## Best Practices
1. **Organize with Tabs**: Group related content into logical tabs
2. **Use Chart Groups**: Group related metrics together
3. **Filter Placement**: Place filters on tabs where they're most relevant
4. **Query Optimization**: Keep queries efficient for better performance
5. **Consistent Formatting**: Use the `format` attribute under each metric to ensure consistent number formatting
## App Configuration
The `config` section supports the following attributes:
| Attribute | Type | Description |
| ----------------- | ------ | ---------------------------------------------------------------- |
| `cache` | bool | Enable/disable caching of query results |
| `cache_ttl` | int | Cache time-to-live in seconds (default: 3600) |
| `hide_llm` | bool | (Optional) Hide the LLM assistant (Orion AI) in the app UI |
| `hide_insights` | bool | (Optional) Hide the Insights panel in the app UI |
| `llm_instruction` | string | (Optional) Custom instruction for the LLM (prompt customization) |
| `style` | object | (Optional) Custom styling configuration (theme and colors) |
Example usage:
```yaml theme={null}
config:
cache: true
cache_ttl: 3600
llm_instruction: "You are a helpful assistant."
```
### Theme Customization
You can customize your app's appearance by selecting from predefined themes or using custom style attributes for advanced color customization. See the [YAML Reference](/reference/intelligent-apps/yaml-reference#style-configuration) for detailed styling options.
## Next Steps
* [Detailed Chart Reference](/reference/intelligent-apps/components)
* [Working with Filters](/reference/intelligent-apps/filters)
* [Advanced Queries](/reference/intelligent-apps/queries)
Example layout:
```yaml theme={null}
layout:
tabs:
- name: overview
title: "Overview"
filters: ["start_date", "product_category"]
items:
- type: chart-group
name: kpi_group
span: 12
entities:
- type: chart
name: total_sales
span: 4
- type: chart
name: total_orders
span: 4
- type: chart
name: sales_by_region
height: 400
span: 6
- type: chart
name: top_products
height: 400
span: 4
- type: chart
name: top_customers
height: 400
span: 4
- type: chart
name: monthly_performance_order
height: 400
span: 8
```
### Interactivity
Make your apps interactive with variables and filters:
* **Variables**: Store values that can be used in queries
* **Filters**: UI elements that update variables
Example filter:
```yaml theme={null}
filters:
- type: dropdown
name: category_filter
title: "Product Category"
affected_variable: product_category
options:
type: sql
query: "SELECT DISTINCT category FROM products"
```
## Query Variables
You can reference variables in your queries using double curly braces:
```yaml theme={null}
query: |
SELECT * FROM orders
WHERE order_date > '{{ start_date }}'
AND order_date < '{{ end_date }}'
{% if product_category != 'all' %}
AND category = '{{ product_category }}'
{% endif %}
```
## Best Practices
1. **Organize with Tabs**: Group related content into logical tabs
2. **Use Chart Groups**: Group related metrics together
3. **Filter Placement**: Place filters on tabs where they're most relevant
4. **Query Optimization**: Keep queries efficient for better performance
5. **Consistent Formatting**: Use the `format` attribute under each metric to ensure consistent number formatting
## App Configuration
The `config` section supports the following attributes:
| Attribute | Type | Description |
| ----------------- | ------ | ---------------------------------------------------------------- |
| `cache` | bool | Enable/disable caching of query results |
| `cache_ttl` | int | Cache time-to-live in seconds (default: 3600) |
| `hide_llm` | bool | (Optional) Hide the LLM assistant (Orion AI) in the app UI |
| `hide_insights` | bool | (Optional) Hide the Insights panel in the app UI |
| `llm_instruction` | string | (Optional) Custom instruction for the LLM (prompt customization) |
| `style` | object | (Optional) Custom styling configuration (theme and colors) |
Example usage:
```yaml theme={null}
config:
cache: true
cache_ttl: 3600
llm_instruction: "You are a helpful assistant."
```
### Theme Customization
You can customize your app's appearance by selecting from predefined themes or using custom style attributes for advanced color customization. See the [YAML Reference](/reference/intelligent-apps/yaml-reference#style-configuration) for detailed styling options.
## Next Steps
* [Detailed Chart Reference](/reference/intelligent-apps/components)
* [Working with Filters](/reference/intelligent-apps/filters)
* [Advanced Queries](/reference/intelligent-apps/queries)