> ## Documentation Index
> Fetch the complete documentation index at: https://docs.datazone.co/llms.txt
> Use this file to discover all available pages before exploring further.
# From Zero to Production!
> In this guide, you will learn how to build a Data Lakehouse from scratch using Datazone, including creating intelligent apps, deploying AI agents, and exposing data via secure endpoints.
## Prerequisites
Before you start building your Data Lakehouse, make sure you have the following prerequisites:
* A Datazone account. If you don't have one, you can sign up [here](https://app.datazone.co/app/sign-up).
* Datazone CLI installed on your local machine. You can install it by following the instructions [here](/installation).
## Task List
To understand how to build a Data Lakehouse from scratch using Datazone, let's follow these steps:
1. 🔌 **Connecting your data source**: Start by connecting AWS S3 as a data source.
2. 📁 **Initialize first project**: Set up your first project and add an Extract component.
3. 🚀 **Run first execution**: Launch your first execution to fetch data from the source.
4. 📄 **Create first pipeline**: Design a simple pipeline to process the data.
5. 🚂 **Run first pipeline**: Execute the pipeline to transform your data.
6. ⏰ **Create first schedule**: Configure periodic runs for automated processing.
7. 🧠 **Create an Intelligent App**: Turn your data pipelines into context-aware applications that observe, reason, and act — not just visualize.
8. 🤖 **Deploy an Agent**: Set up AI-powered automation for monitoring and insights.
9. 🔗 **Expose data via Endpoints**: Create secure APIs for your processed data.
10. 🏆 **Access the data**: Learn how to query and use the processed data.
## 🔌 Connect Source
1.Go to **Settings** from the top-right user menu, then select **Sources** under the **Integrations** section.
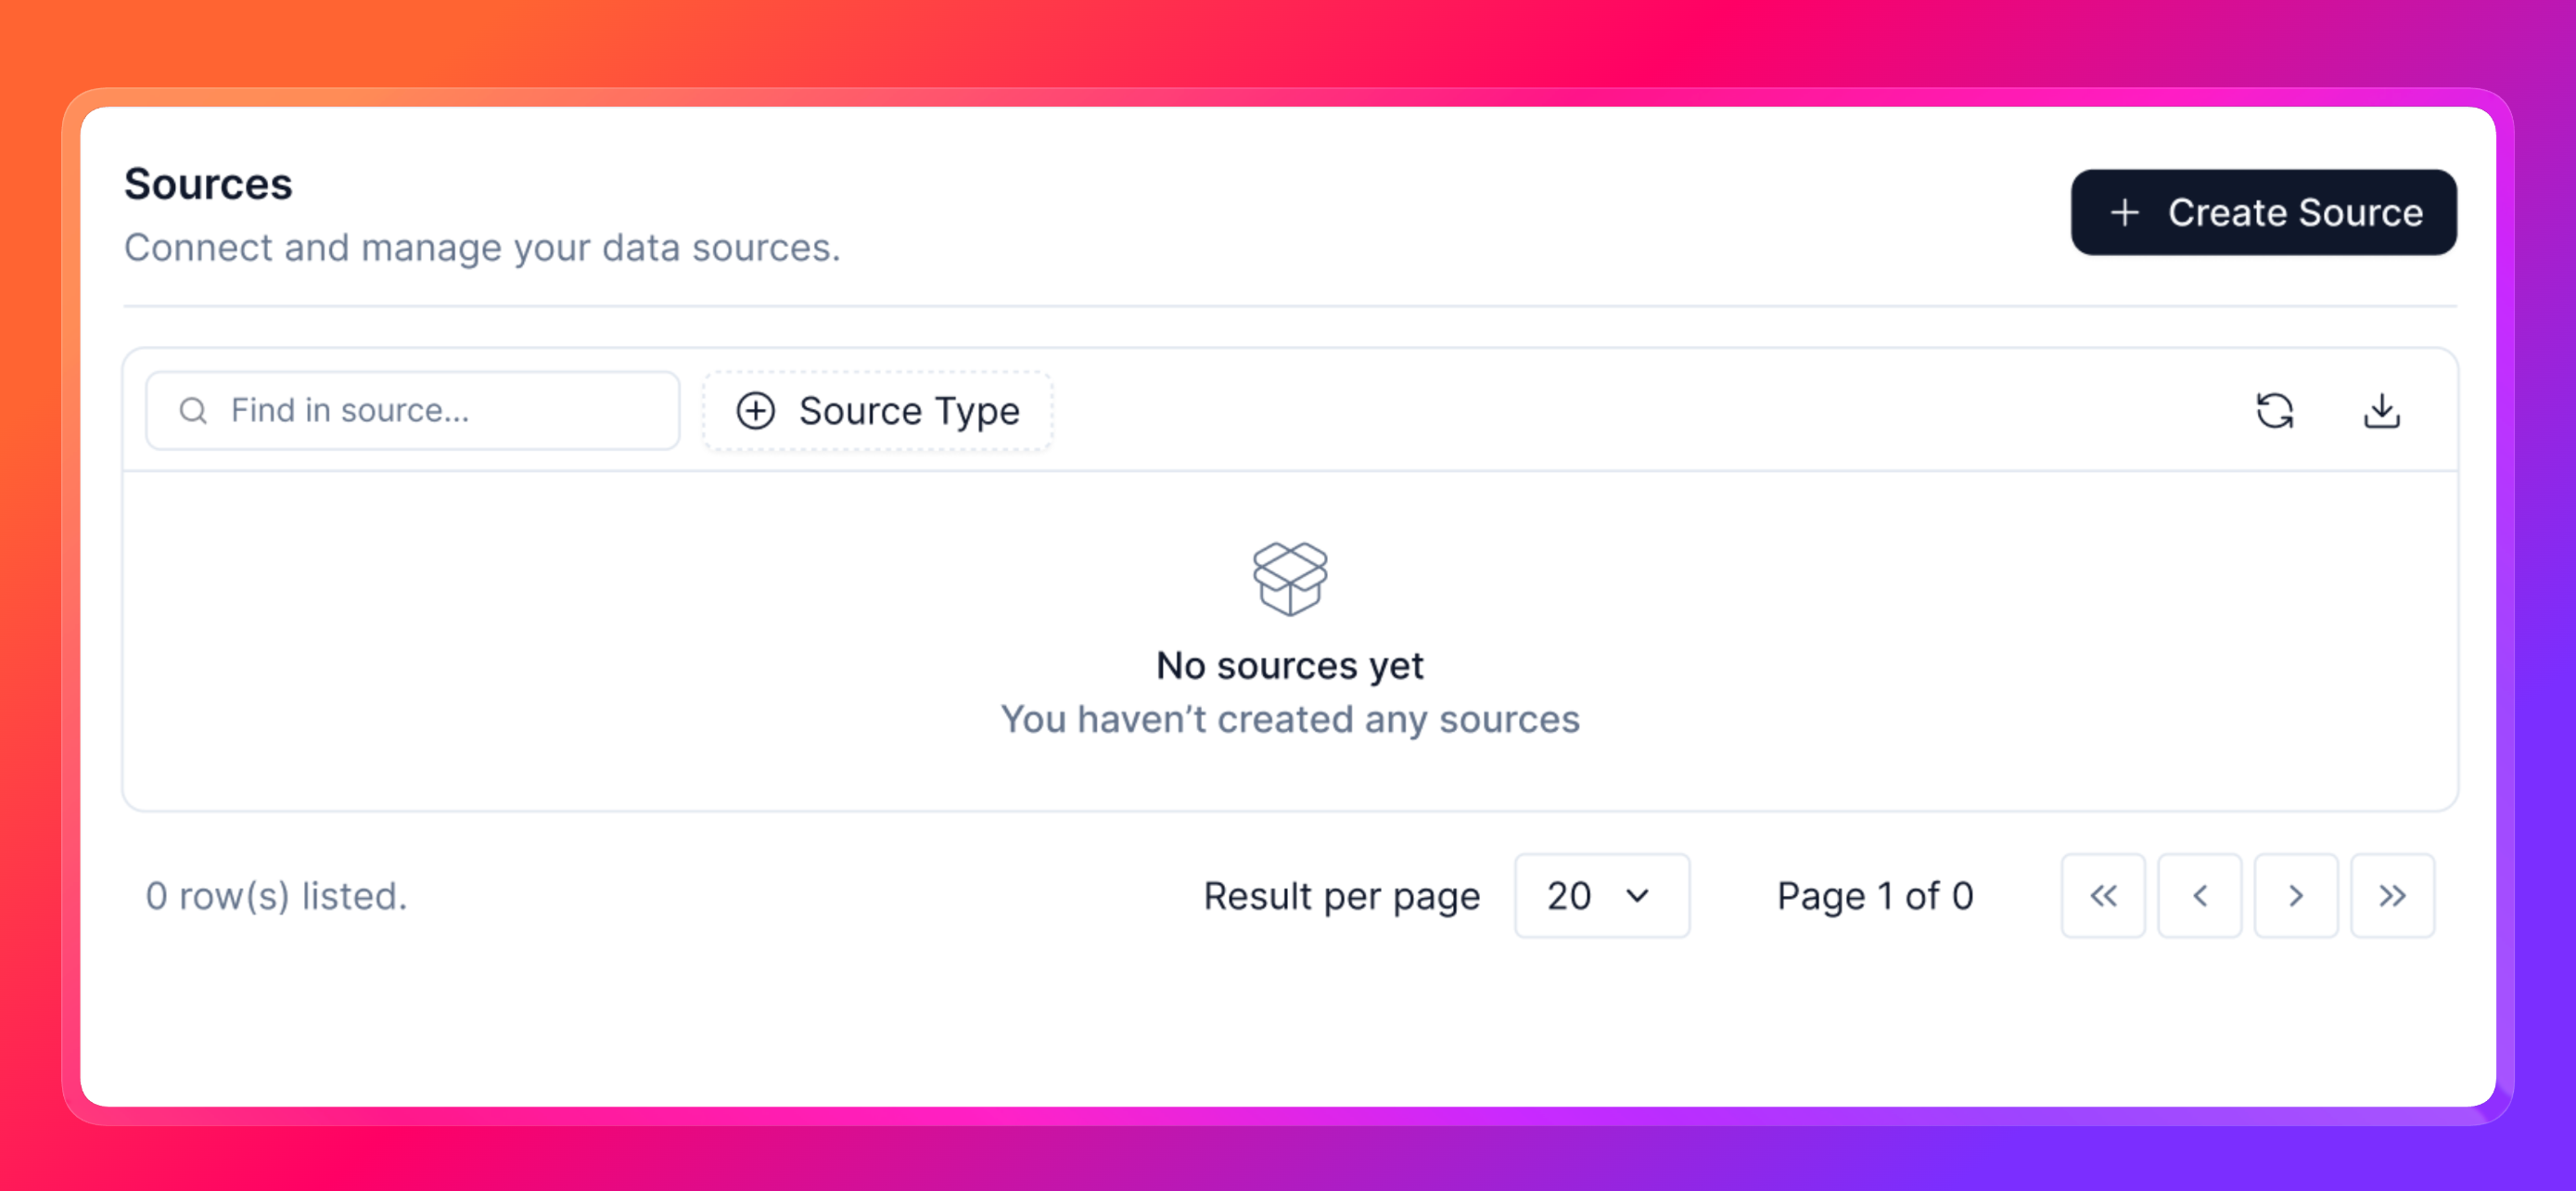 1. Click on the **Create Source** button.
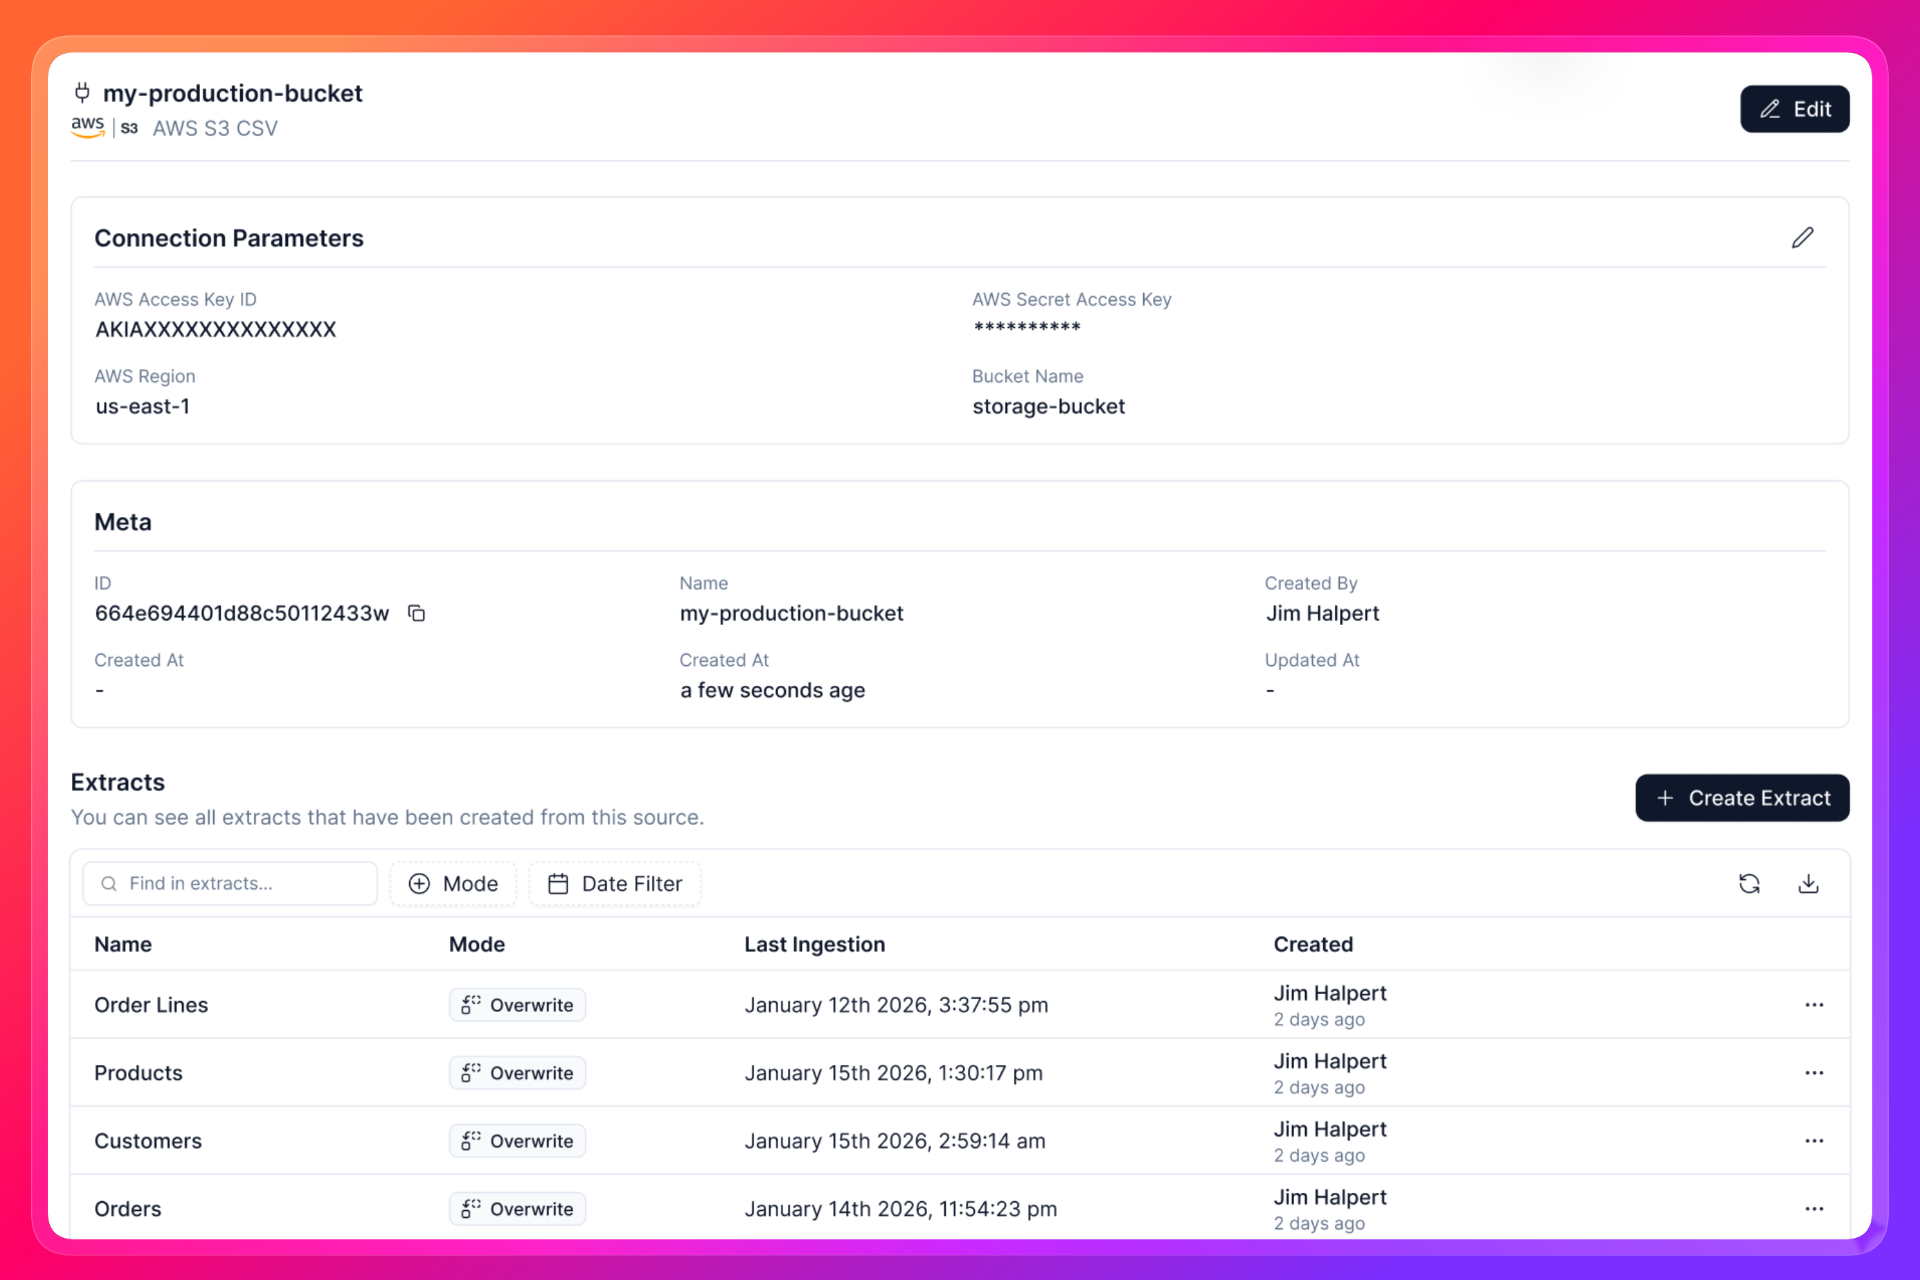
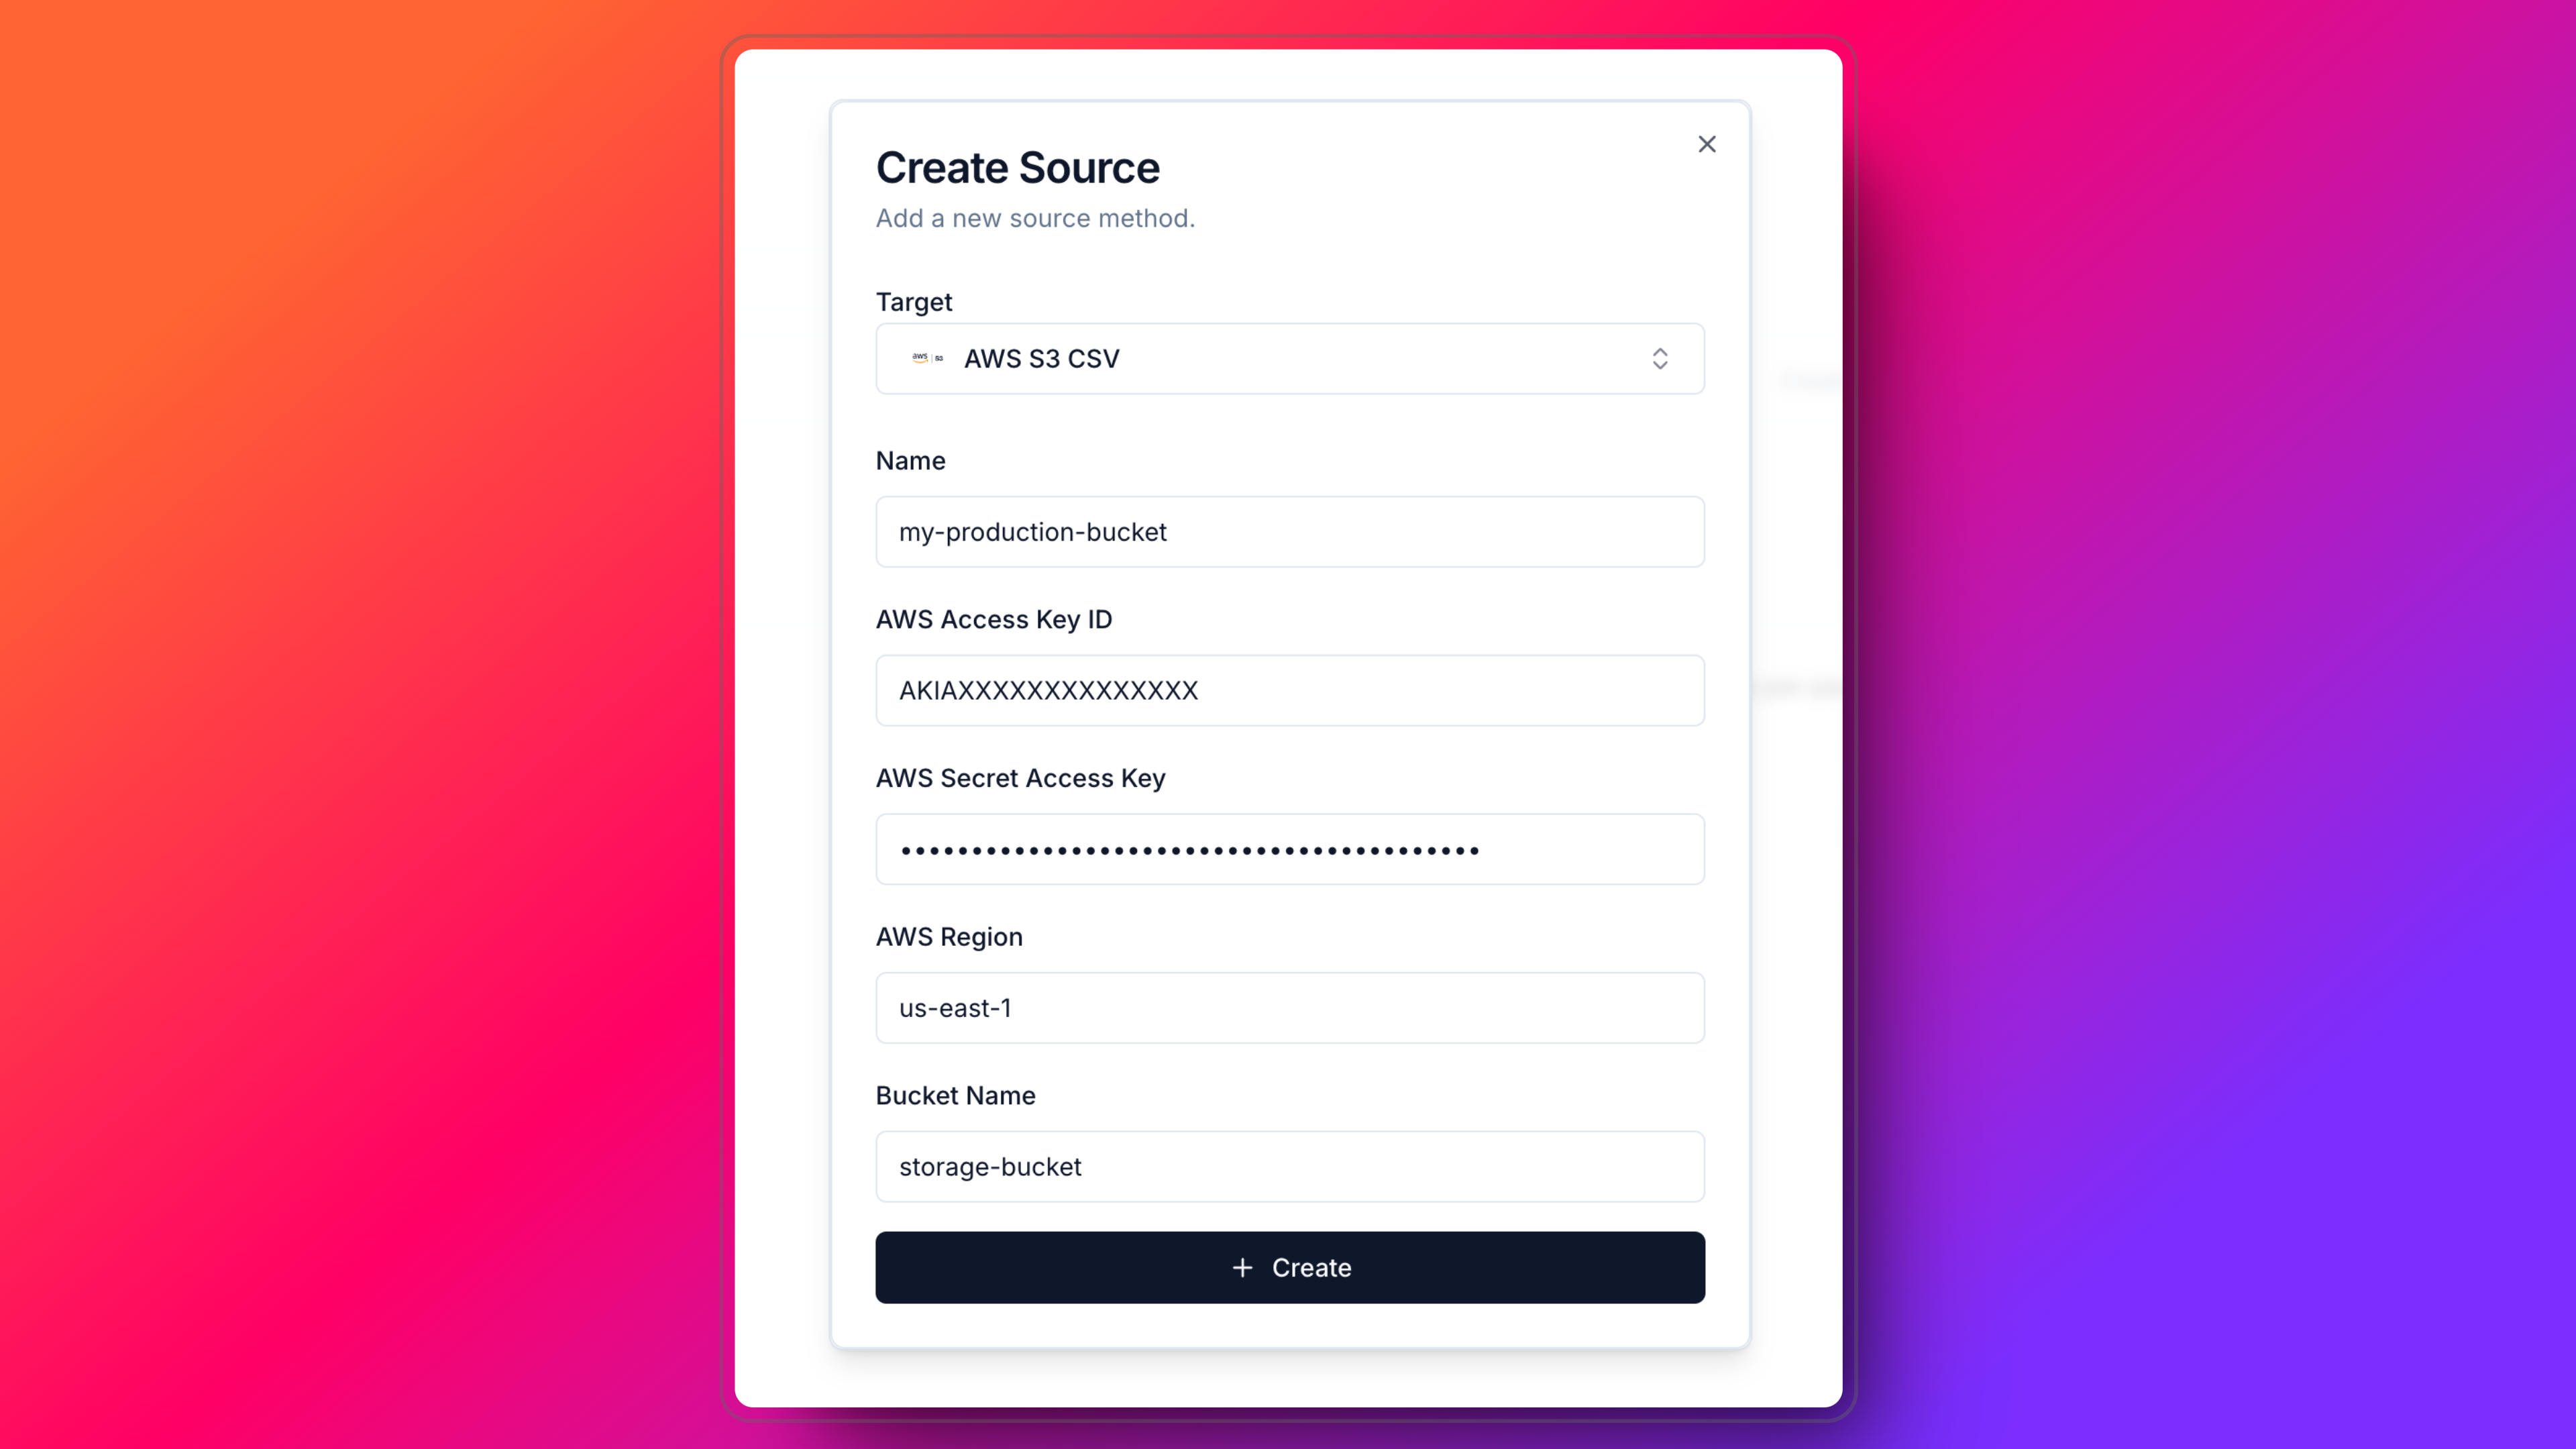 1. Fill in the required fields and click on the **Create** button. And you are done! You have successfully connected your source. Check your source in the **Settings** > **Sources** page.
 ## 📁 Create Project
1. Go to the **Projects** page by clicking on the **Projects** tab in the sidebar.
## 📁 Create Project
1. Go to the **Projects** page by clicking on the **Projects** tab in the sidebar.
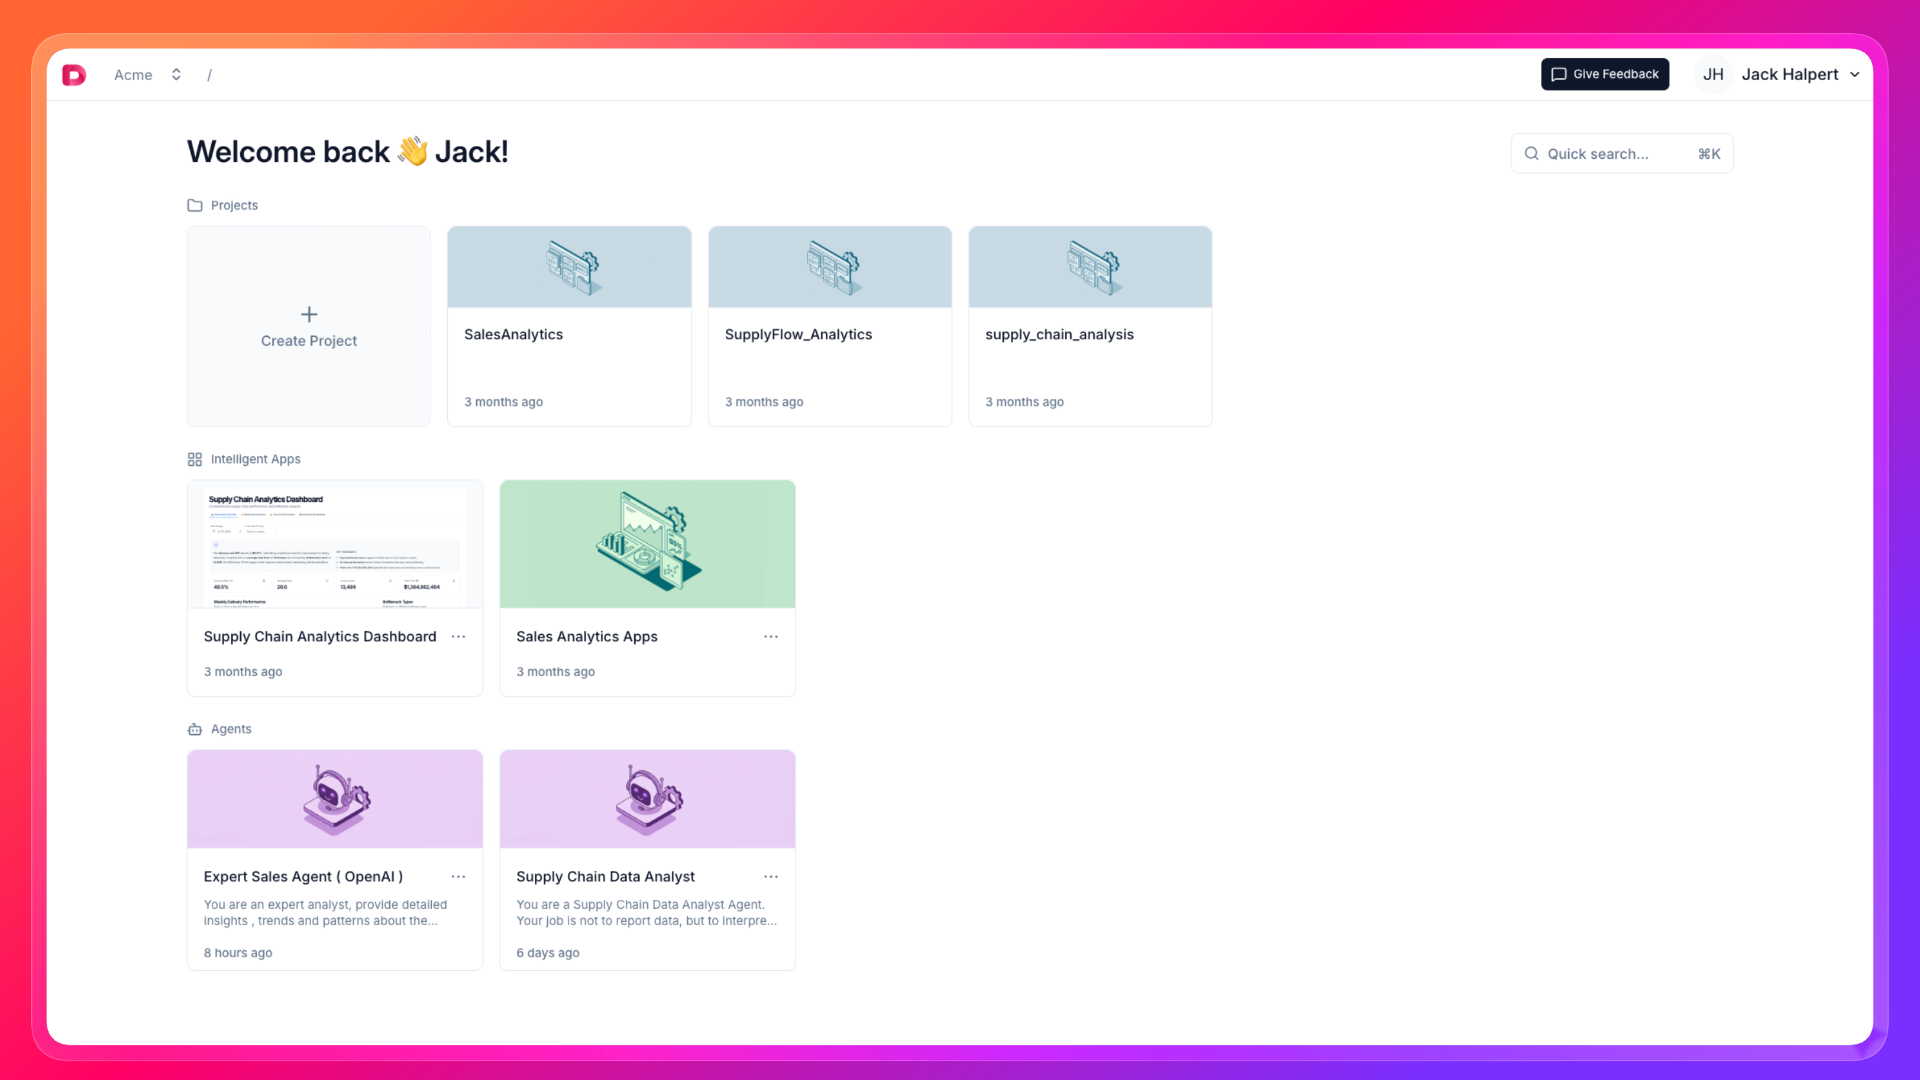 1. Click on the **Create Project** button.
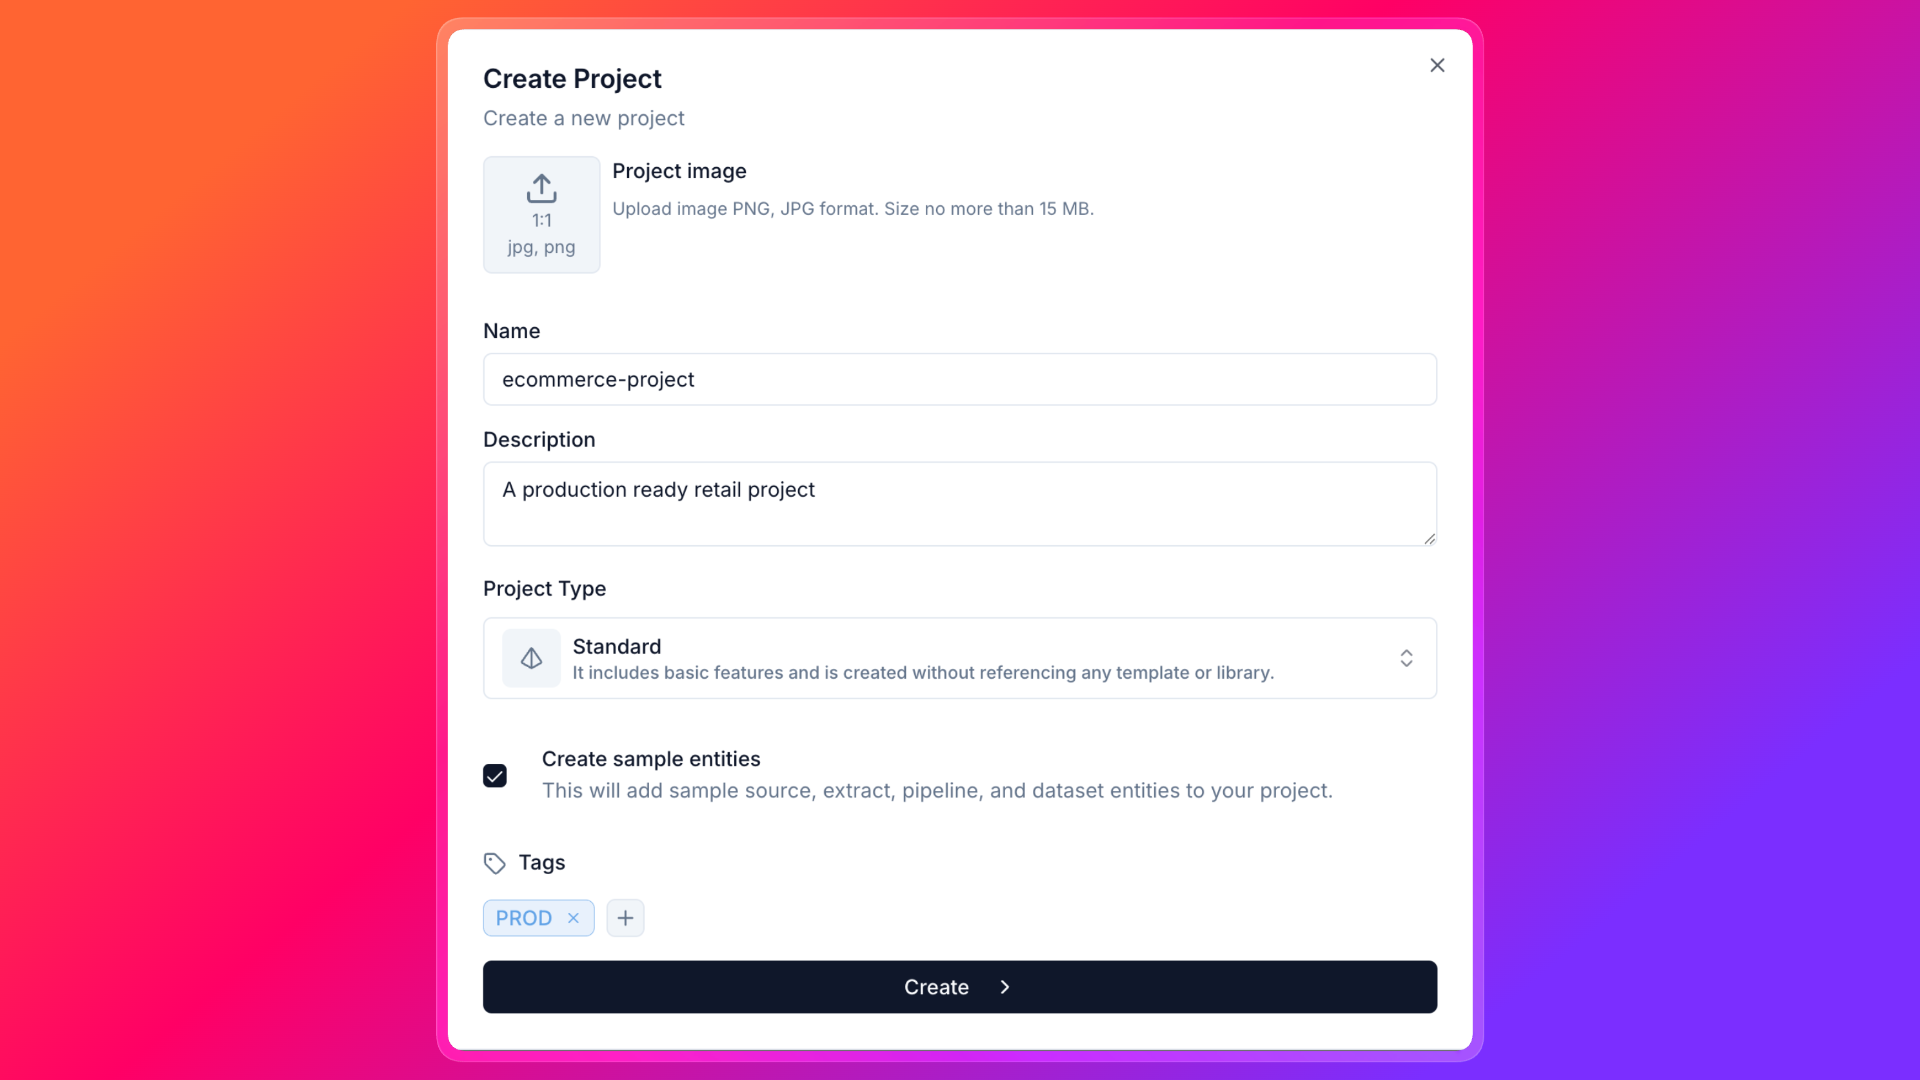 1. Fill in the required fields and click on the **Create** button. Boom! 🚀 You have successfully created your first project.
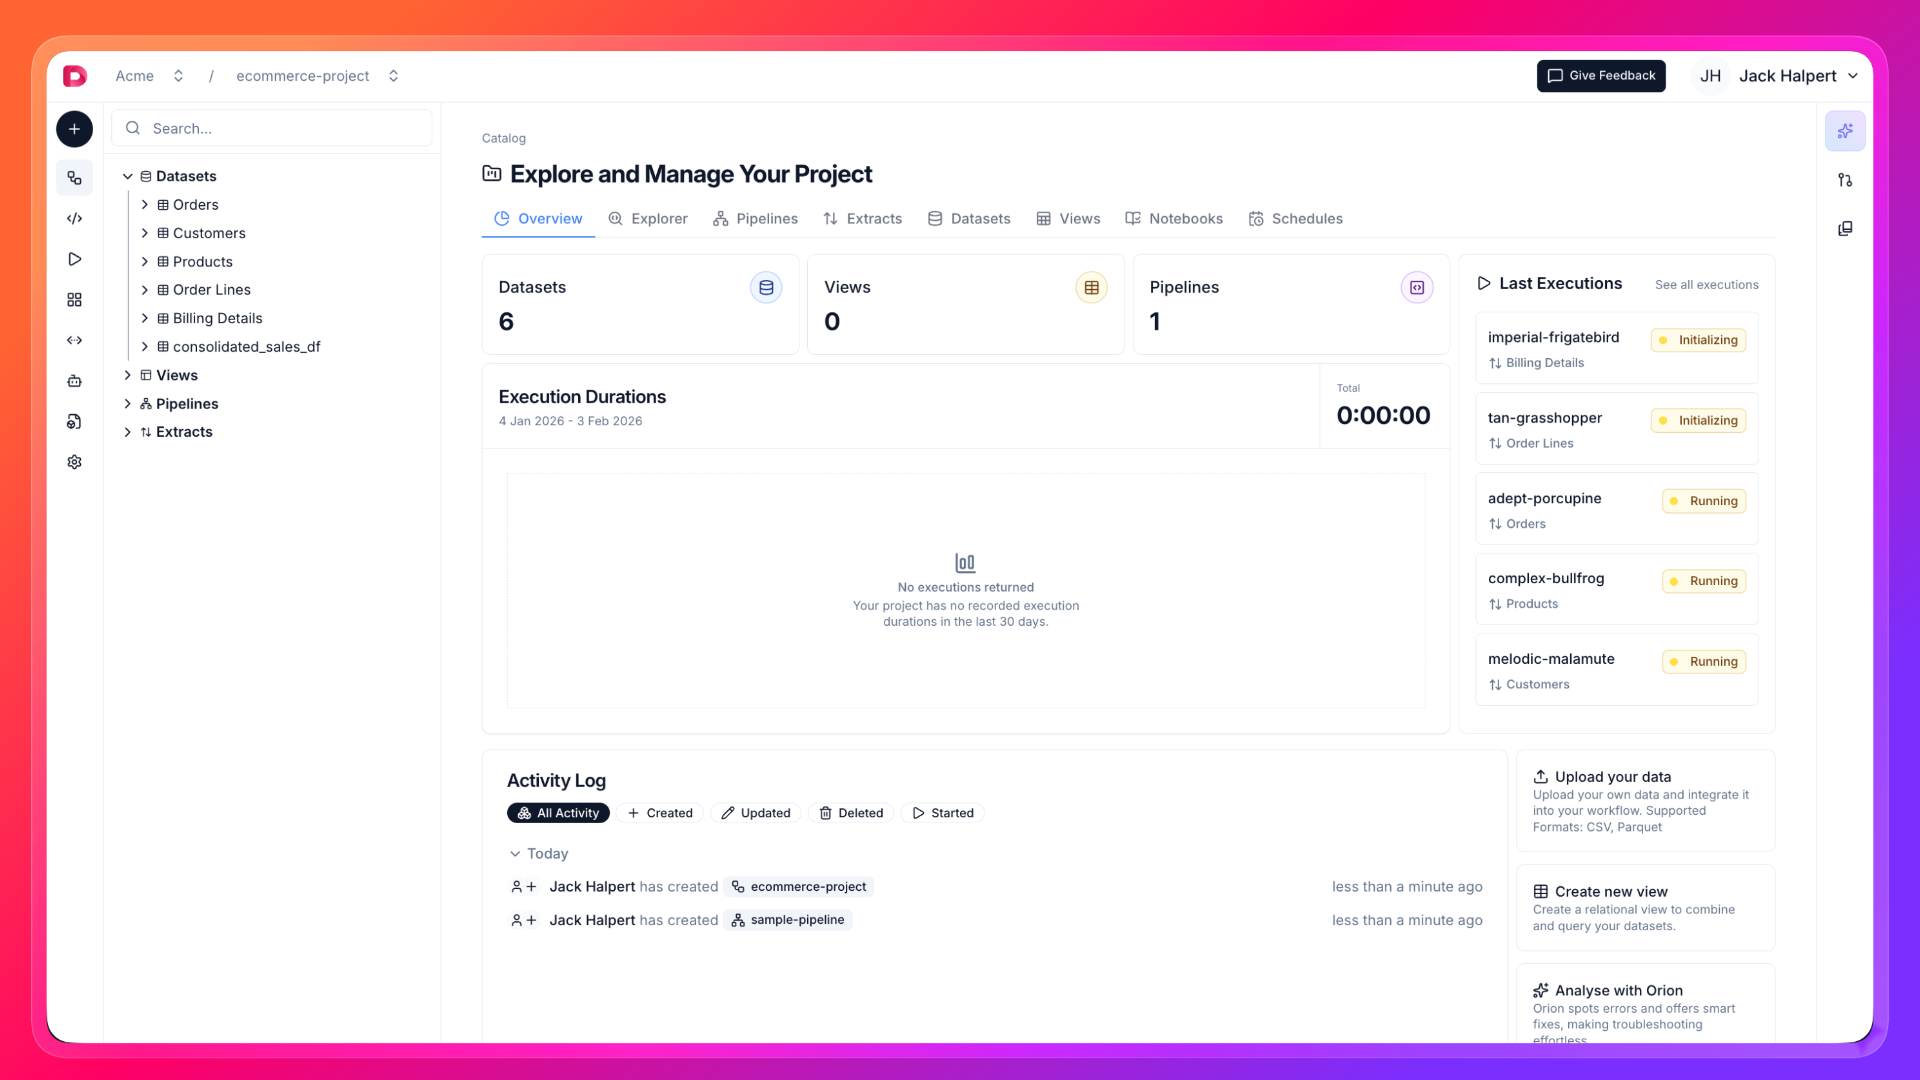 ### Define your Extract
1. On your project page, click on the **Add** button in the top right corner to add a new entity.
2. Select **Extract** as the entity type.
### Define your Extract
1. On your project page, click on the **Add** button in the top right corner to add a new entity.
2. Select **Extract** as the entity type.
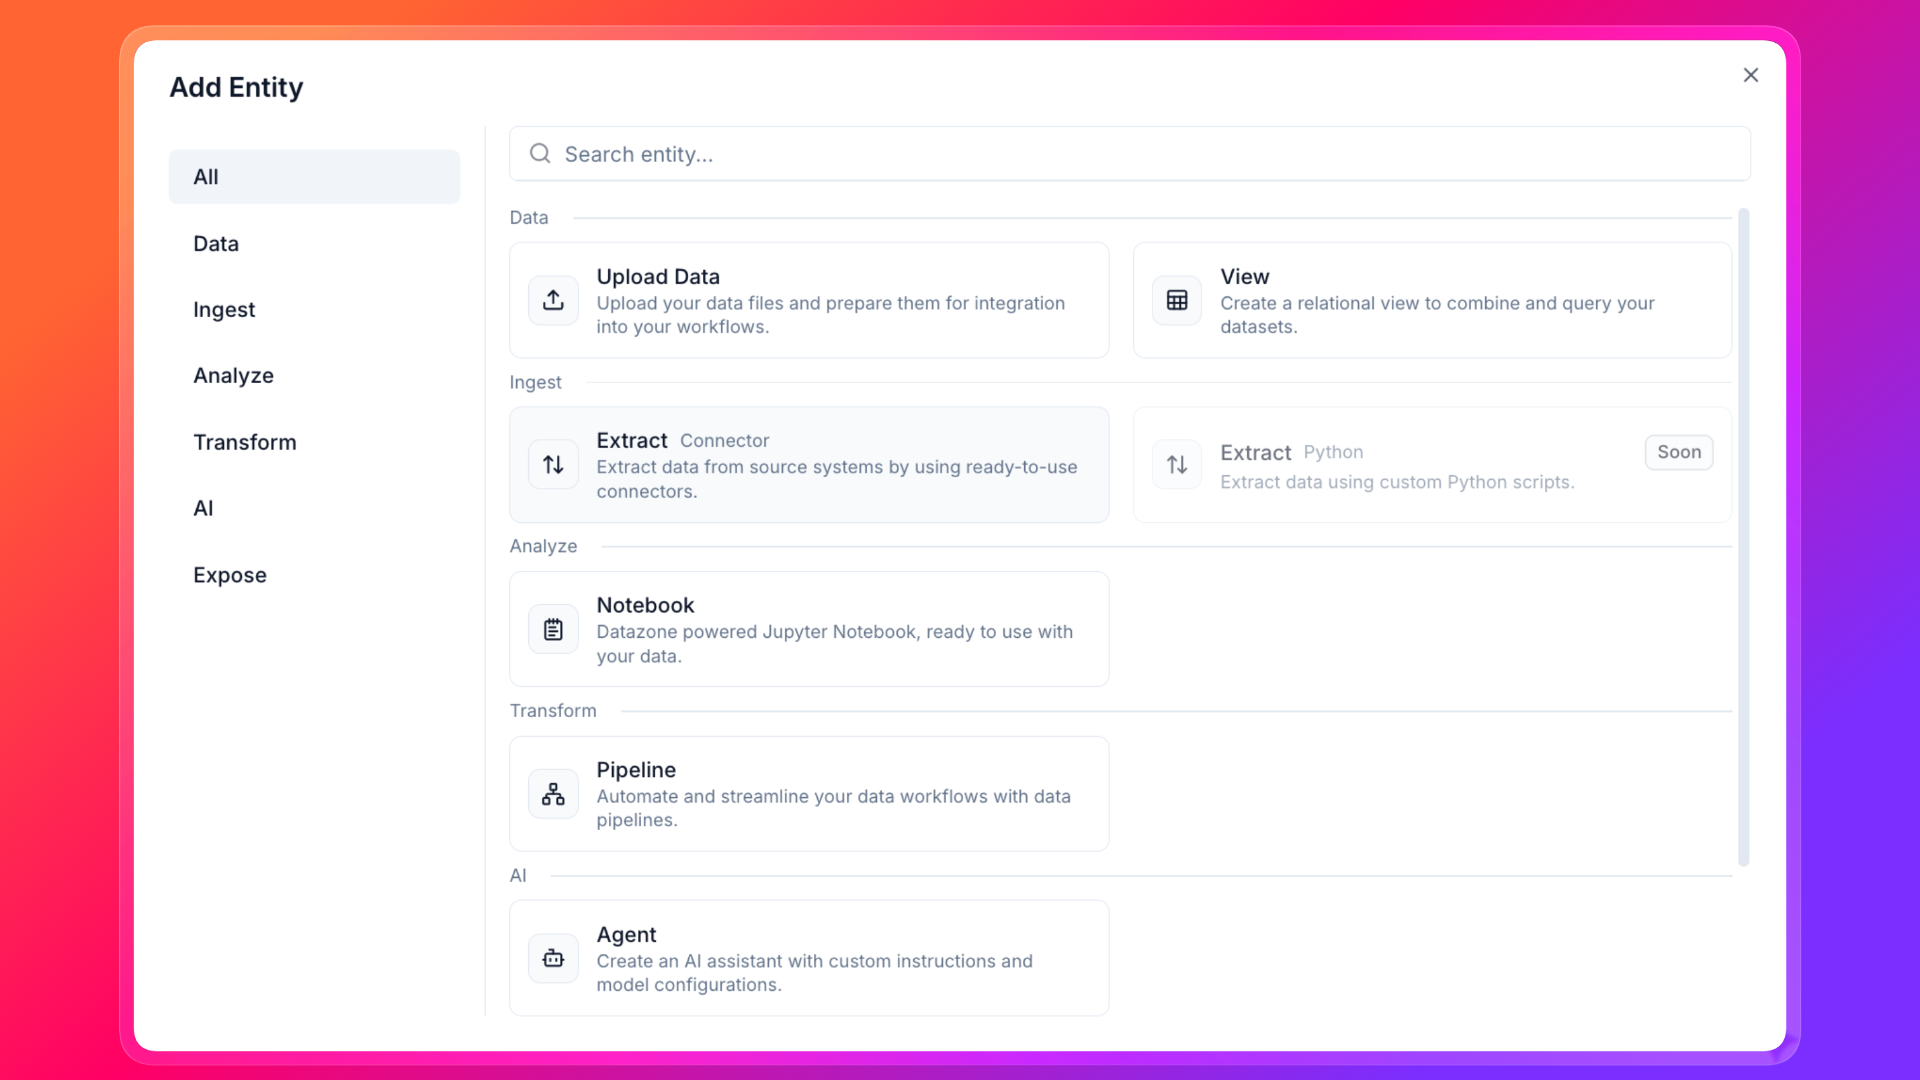 1. Fill in the required fields and click on the **Create** button. You have successfully created your first Extract entity.
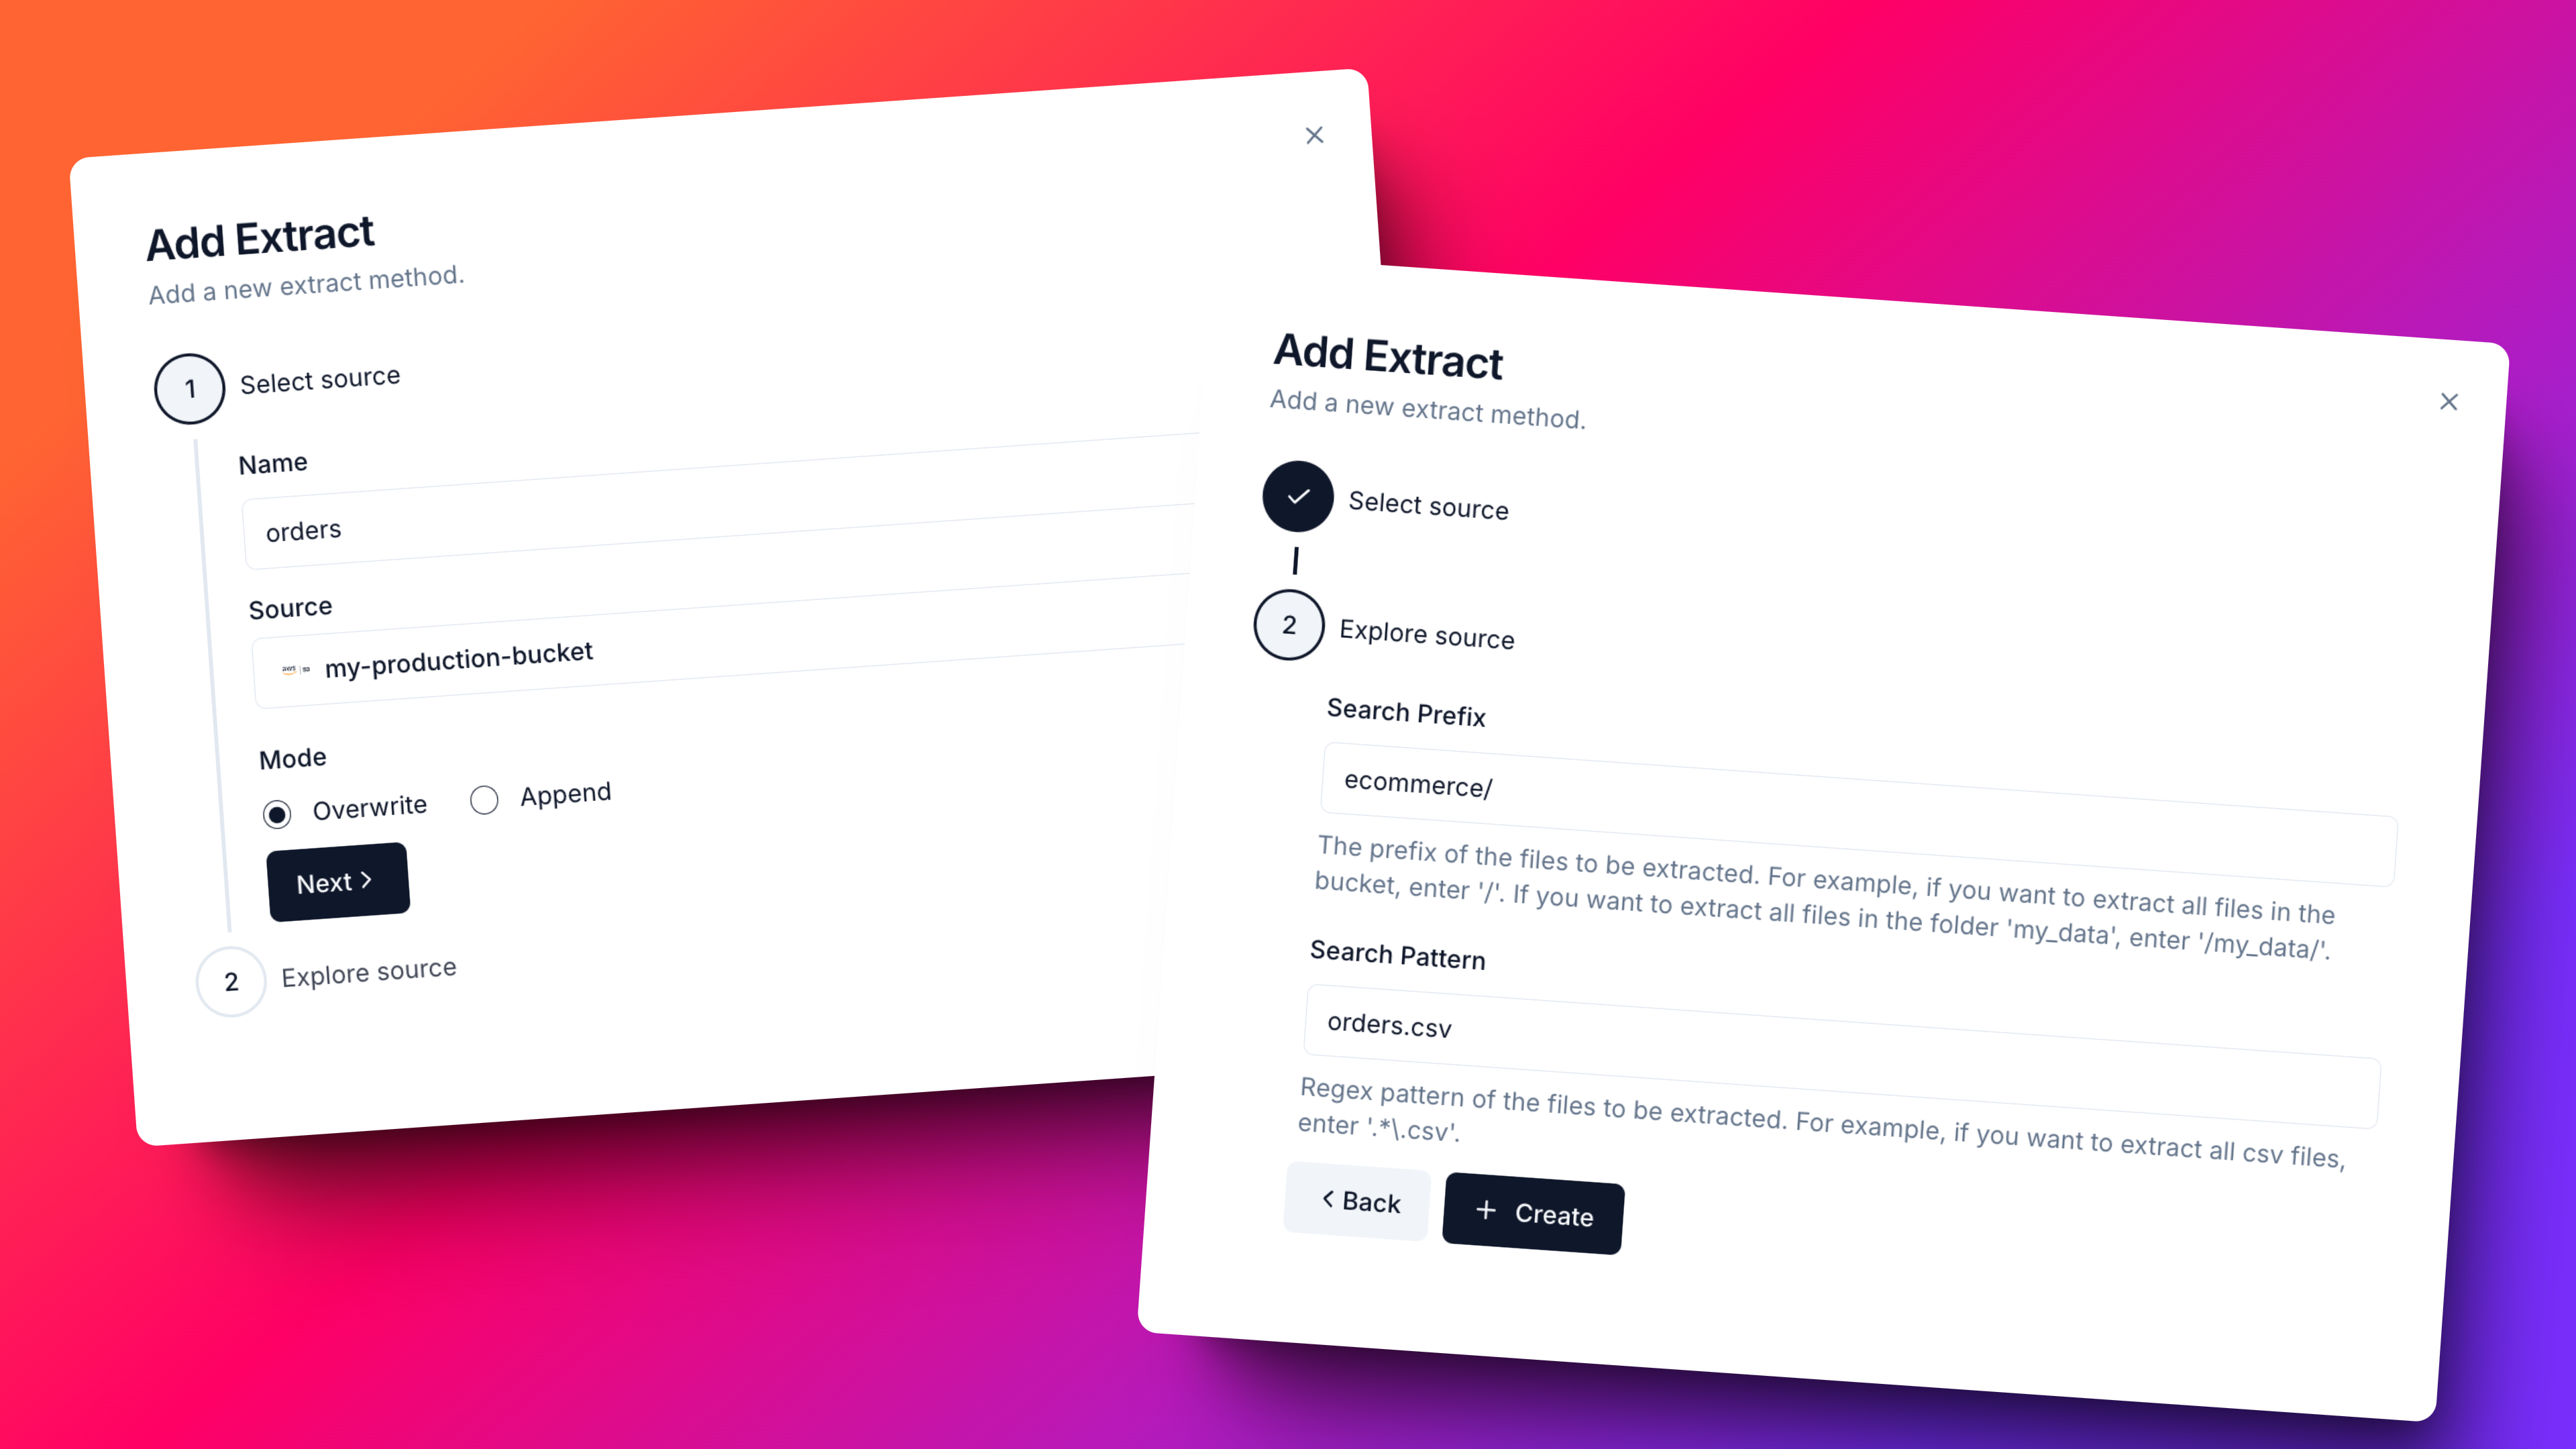 **Base Attributes**
* `name`: The name of the extract.
* `source`: The source you want to extract data from. (It is already selected)
* `mode`: The mode of the extract. Options are;
* `Overwrite`: Fetch all the data from the source every time.
* `Append`: Fetch only the new data from the source.
**Source Dependent Attributes** (In this case, AWS S3). Check the [AWS S3](/sources/awss3) page for more details.
* `search_prefix`: The prefix you want to search for in the bucket.
* `search_pattern`: The pattern you want to search for in the bucket.
## 🚀 Run First Execution and Check the Data
1. Click to the created Extract entity and move to the **Executions** tab. Via clicking the **Run** button, you can start your first execution.
**Base Attributes**
* `name`: The name of the extract.
* `source`: The source you want to extract data from. (It is already selected)
* `mode`: The mode of the extract. Options are;
* `Overwrite`: Fetch all the data from the source every time.
* `Append`: Fetch only the new data from the source.
**Source Dependent Attributes** (In this case, AWS S3). Check the [AWS S3](/sources/awss3) page for more details.
* `search_prefix`: The prefix you want to search for in the bucket.
* `search_pattern`: The pattern you want to search for in the bucket.
## 🚀 Run First Execution and Check the Data
1. Click to the created Extract entity and move to the **Executions** tab. Via clicking the **Run** button, you can start your first execution.
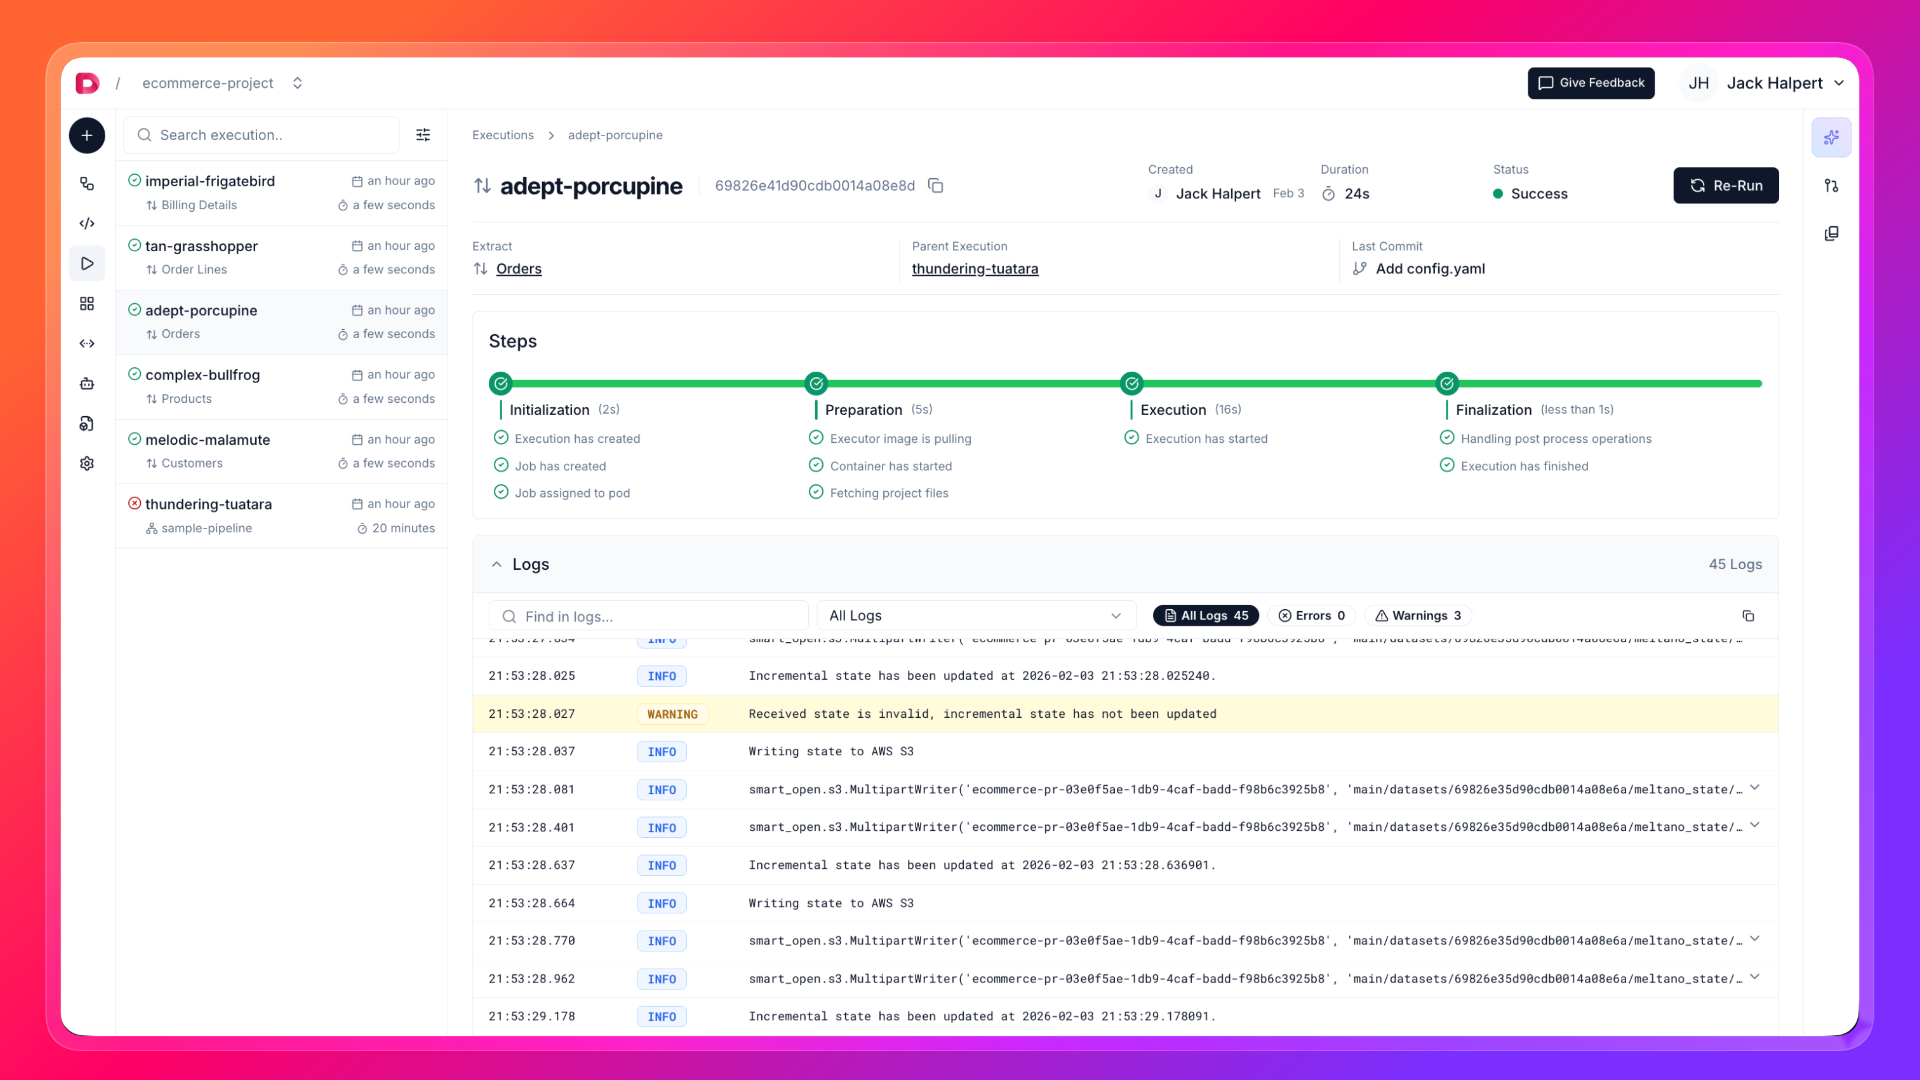
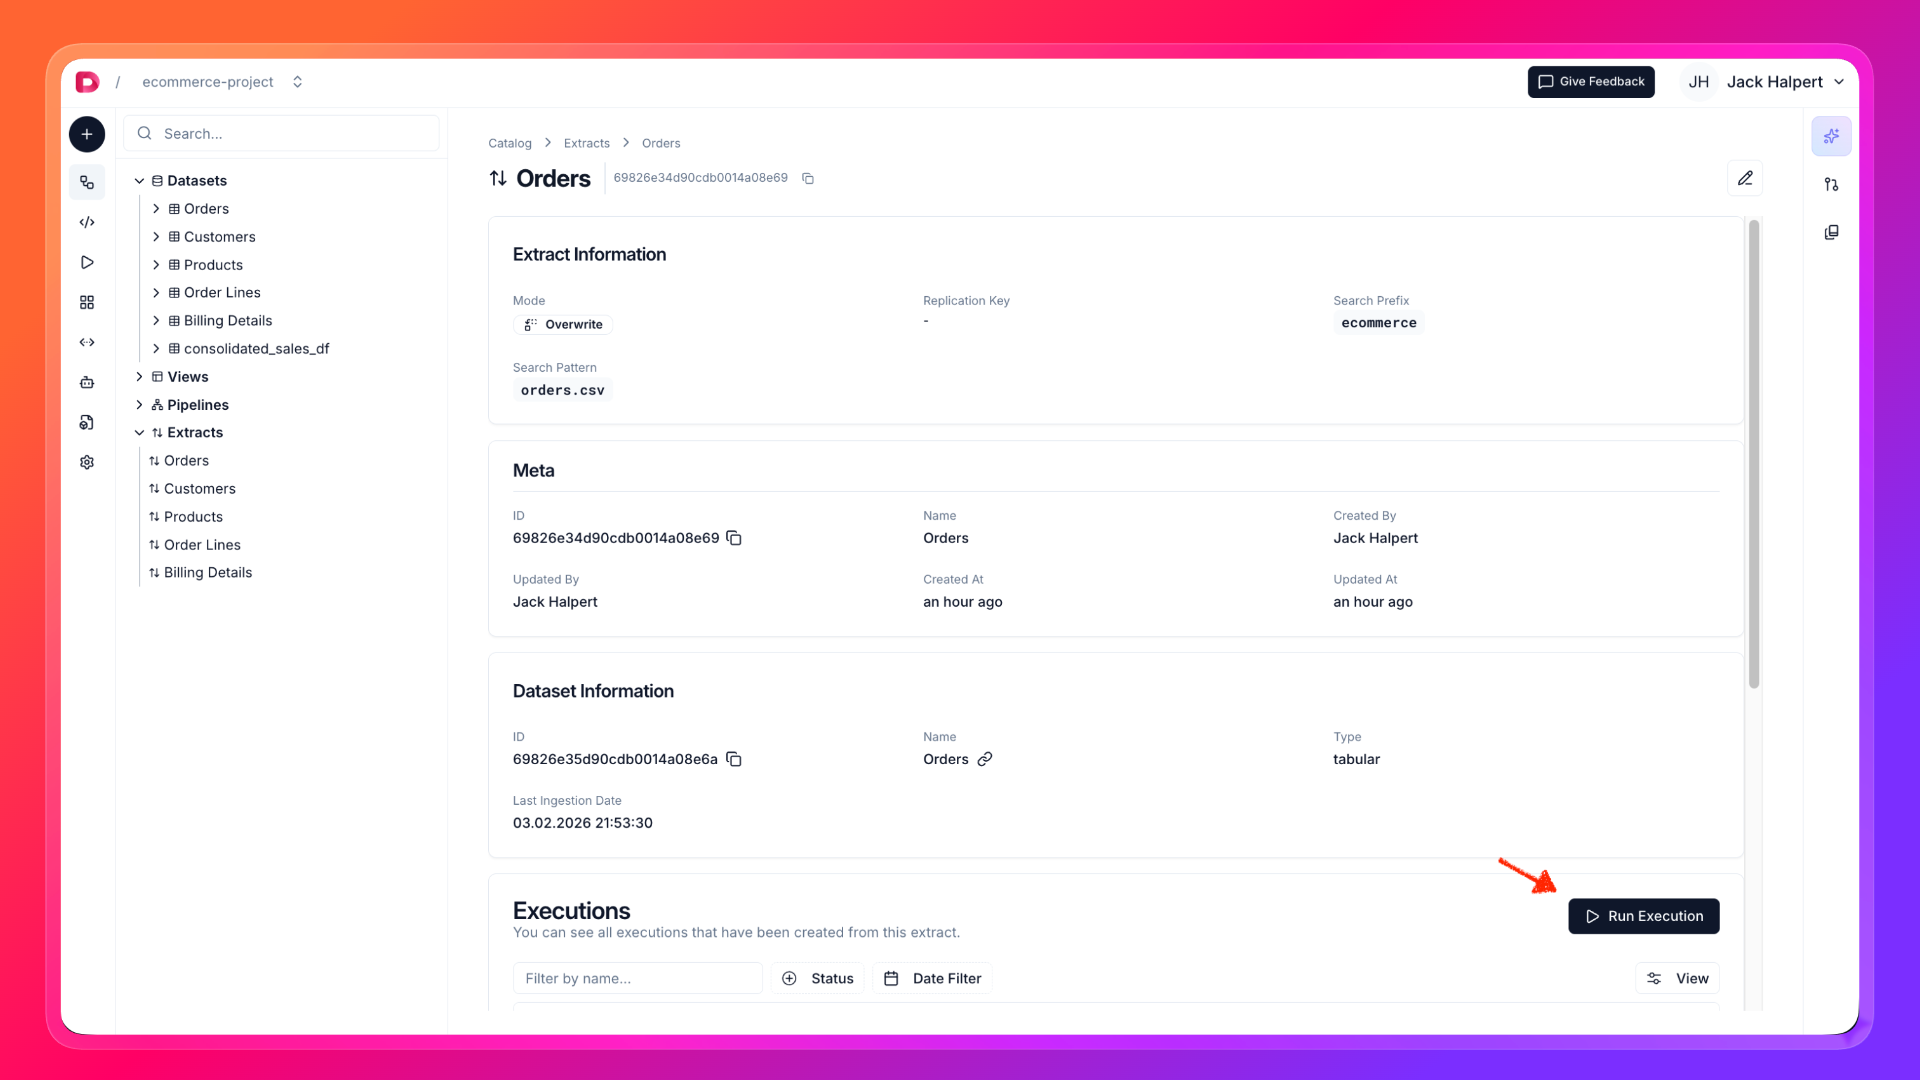 1. Simultaneously, you can check the execution logs and the other details in the **Logs** tab. You can cancel the execution if you want.
After a while, execution will be completed and you notice the new dataset in left explorer. You can check the data by clicking on the dataset.
1. Simultaneously, you can check the execution logs and the other details in the **Logs** tab. You can cancel the execution if you want.
After a while, execution will be completed and you notice the new dataset in left explorer. You can check the data by clicking on the dataset.
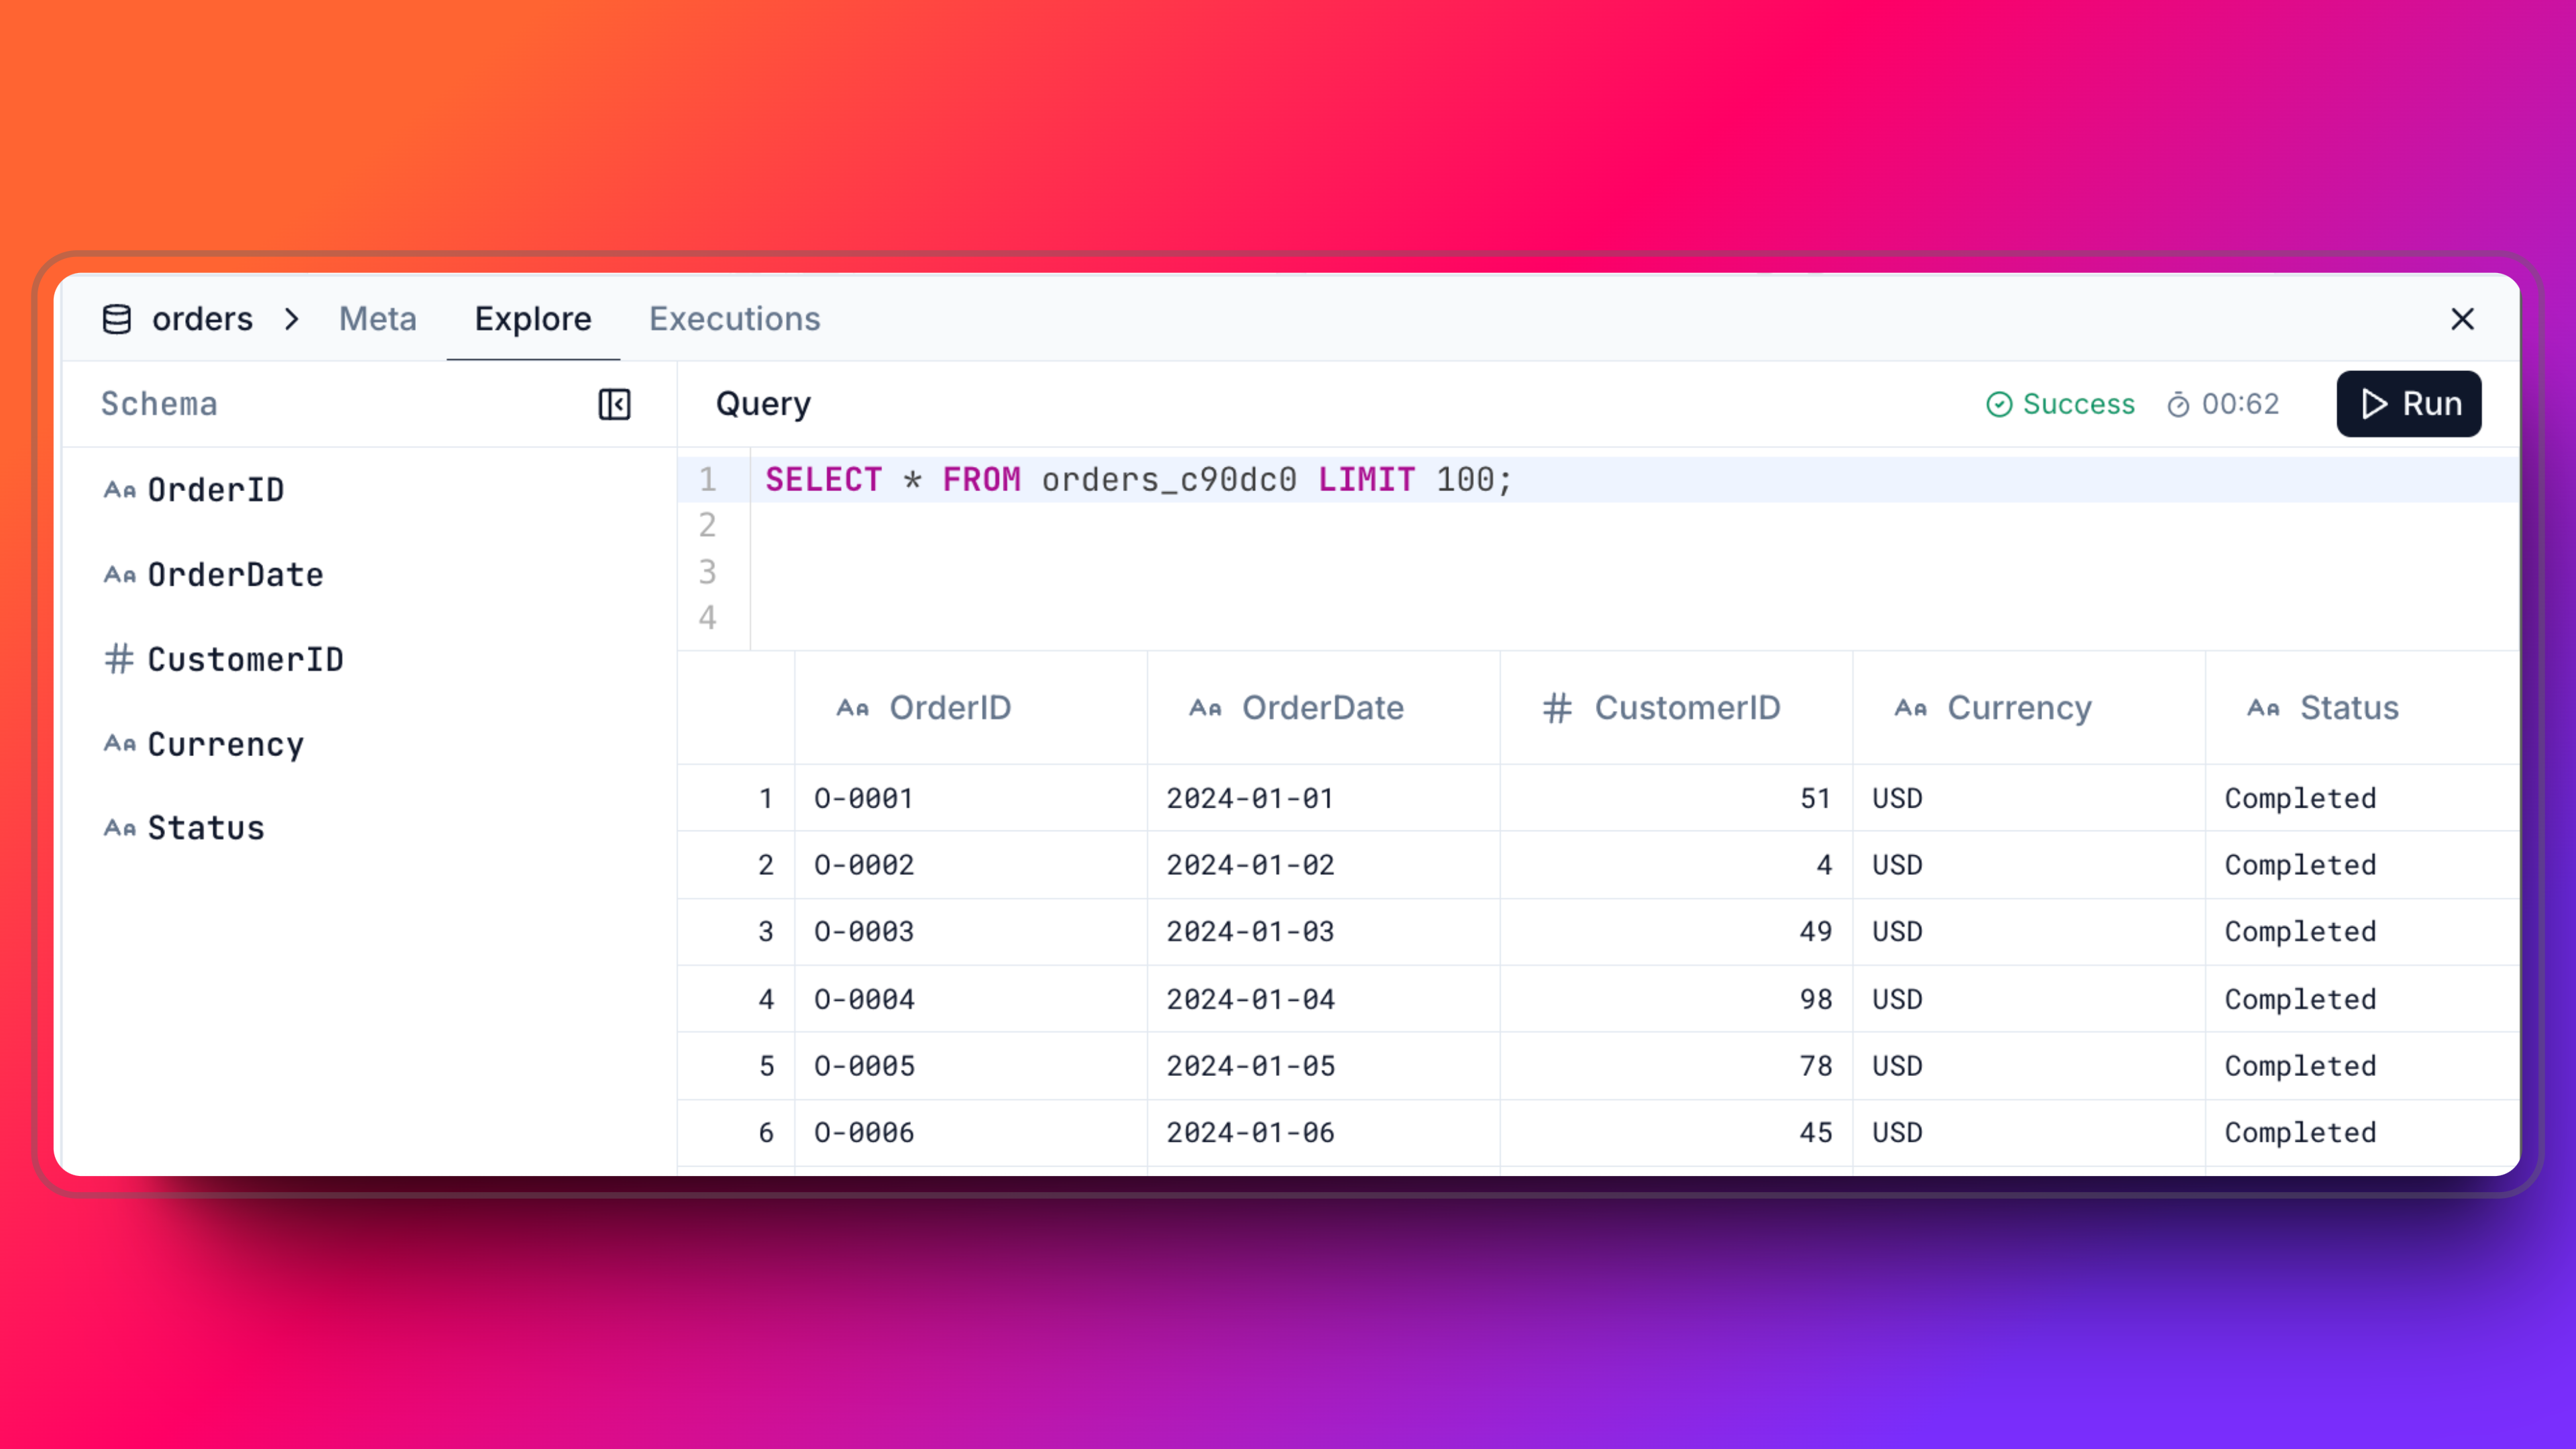
 1. On the dataset drawer, you can see the data fetched from the source. You can also check the schema and make queries on the data to explore it.
 1. With above way, we can fetch the other csv files from the source and create the datasets for each of them.
## ⌨️ Click Less, Code More: Create First Pipeline
If you have already created your project on the UI, open the project page and move to the "Code" section in the left tabs. For local development, clone it using the Datazone CLI.
```shell theme={null}
datazone project clone
```
You will see:
```text theme={null}
Repository has initialized
👉 Go to repository directory: cd ecommerce-project/
```
Check your project folder
```shell theme={null}
> cd ecommerce-project/
> ls -ll
ecommerce-project/
├── README.md
├── hello-world.py
├── config.yml
```
1. We can create our pipeline file in the project folder. Let's create a new file named `order_reports.py` in the project folder.
```python order_reports.py theme={null}
from datazone import transform, Input, Dataset
from pyspark.sql import functions as F
@transform(
input_mapping={
"orders": Input(Dataset(alias="orders_c90dc0")),
"order_lines": Input(Dataset(alias="order_lines_8c5238")),
"customers": Input(Dataset(alias="customers_9cd9ab")),
}
)
def join_tables(orders, order_lines, customers):
return orders.join(order_lines, on="OrderID", how="inner").join(
customers, on="CustomerID", how="inner"
)
@transform(input_mapping={"joined": Input(join_tables)}, materialized=True)
def sales_by_country(joined):
country_report = (
joined.groupBy("Country")
.agg(
F.sum("TotalAmount").alias("TotalSales"),
F.count("OrderID").alias("OrderCount"),
)
.orderBy("TotalSales", ascending=False)
)
return country_report
@transform(input_mapping={"joined": Input(join_tables)}, materialized=True)
def most_popular_products(joined):
product_report = (
joined.groupBy("ProductID")
.agg(
F.sum("TotalAmount").alias("TotalSales"),
F.sum("Quantity").alias("TotalQuantity"),
F.avg("UnitPrice").alias("AveragePrice"),
F.count("OrderID").alias("OrderCount"),
)
.orderBy("TotalSales", ascending=False)
)
return product_report
```
Above code is a simple pipeline that joins three tables and creates two reports.
* You can see that we have two functions that are decorated with `@transform`. These functions are the steps of the pipeline.
You can specify the input datasets and the output dataset of the function by using the `input_mapping` and `output_mapping` classes.
* The first function `join_tables` joins the `orders`, `order_lines`, and `customers` tables.
* The second function `sales_by_country` calculates the total sales and order count by country.
* The third function `most_popular_products` calculates the total sales, total quantity, average price, and order count by product.
You can create your own pipeline according to your needs. Also you can check the [Transform Functions](/transform-functions)
page to see the available functions.
1. Then you need to reference this pipeline in the `config.yml` file.
```yaml config.yml theme={null}
project_name: ecommerce-project
project_id: 673f8ef62a466524757a7de1
pipelines:
- alias: order_reports
path: order_reports.py
```
1. Write your code in the "Code" section of the project page and click the Deploy button.
And you will see the deployed pipeline if you click the newly created pipeline in the project page.
1. With above way, we can fetch the other csv files from the source and create the datasets for each of them.
## ⌨️ Click Less, Code More: Create First Pipeline
If you have already created your project on the UI, open the project page and move to the "Code" section in the left tabs. For local development, clone it using the Datazone CLI.
```shell theme={null}
datazone project clone
```
You will see:
```text theme={null}
Repository has initialized
👉 Go to repository directory: cd ecommerce-project/
```
Check your project folder
```shell theme={null}
> cd ecommerce-project/
> ls -ll
ecommerce-project/
├── README.md
├── hello-world.py
├── config.yml
```
1. We can create our pipeline file in the project folder. Let's create a new file named `order_reports.py` in the project folder.
```python order_reports.py theme={null}
from datazone import transform, Input, Dataset
from pyspark.sql import functions as F
@transform(
input_mapping={
"orders": Input(Dataset(alias="orders_c90dc0")),
"order_lines": Input(Dataset(alias="order_lines_8c5238")),
"customers": Input(Dataset(alias="customers_9cd9ab")),
}
)
def join_tables(orders, order_lines, customers):
return orders.join(order_lines, on="OrderID", how="inner").join(
customers, on="CustomerID", how="inner"
)
@transform(input_mapping={"joined": Input(join_tables)}, materialized=True)
def sales_by_country(joined):
country_report = (
joined.groupBy("Country")
.agg(
F.sum("TotalAmount").alias("TotalSales"),
F.count("OrderID").alias("OrderCount"),
)
.orderBy("TotalSales", ascending=False)
)
return country_report
@transform(input_mapping={"joined": Input(join_tables)}, materialized=True)
def most_popular_products(joined):
product_report = (
joined.groupBy("ProductID")
.agg(
F.sum("TotalAmount").alias("TotalSales"),
F.sum("Quantity").alias("TotalQuantity"),
F.avg("UnitPrice").alias("AveragePrice"),
F.count("OrderID").alias("OrderCount"),
)
.orderBy("TotalSales", ascending=False)
)
return product_report
```
Above code is a simple pipeline that joins three tables and creates two reports.
* You can see that we have two functions that are decorated with `@transform`. These functions are the steps of the pipeline.
You can specify the input datasets and the output dataset of the function by using the `input_mapping` and `output_mapping` classes.
* The first function `join_tables` joins the `orders`, `order_lines`, and `customers` tables.
* The second function `sales_by_country` calculates the total sales and order count by country.
* The third function `most_popular_products` calculates the total sales, total quantity, average price, and order count by product.
You can create your own pipeline according to your needs. Also you can check the [Transform Functions](/transform-functions)
page to see the available functions.
1. Then you need to reference this pipeline in the `config.yml` file.
```yaml config.yml theme={null}
project_name: ecommerce-project
project_id: 673f8ef62a466524757a7de1
pipelines:
- alias: order_reports
path: order_reports.py
```
1. Write your code in the "Code" section of the project page and click the Deploy button.
And you will see the deployed pipeline if you click the newly created pipeline in the project page.
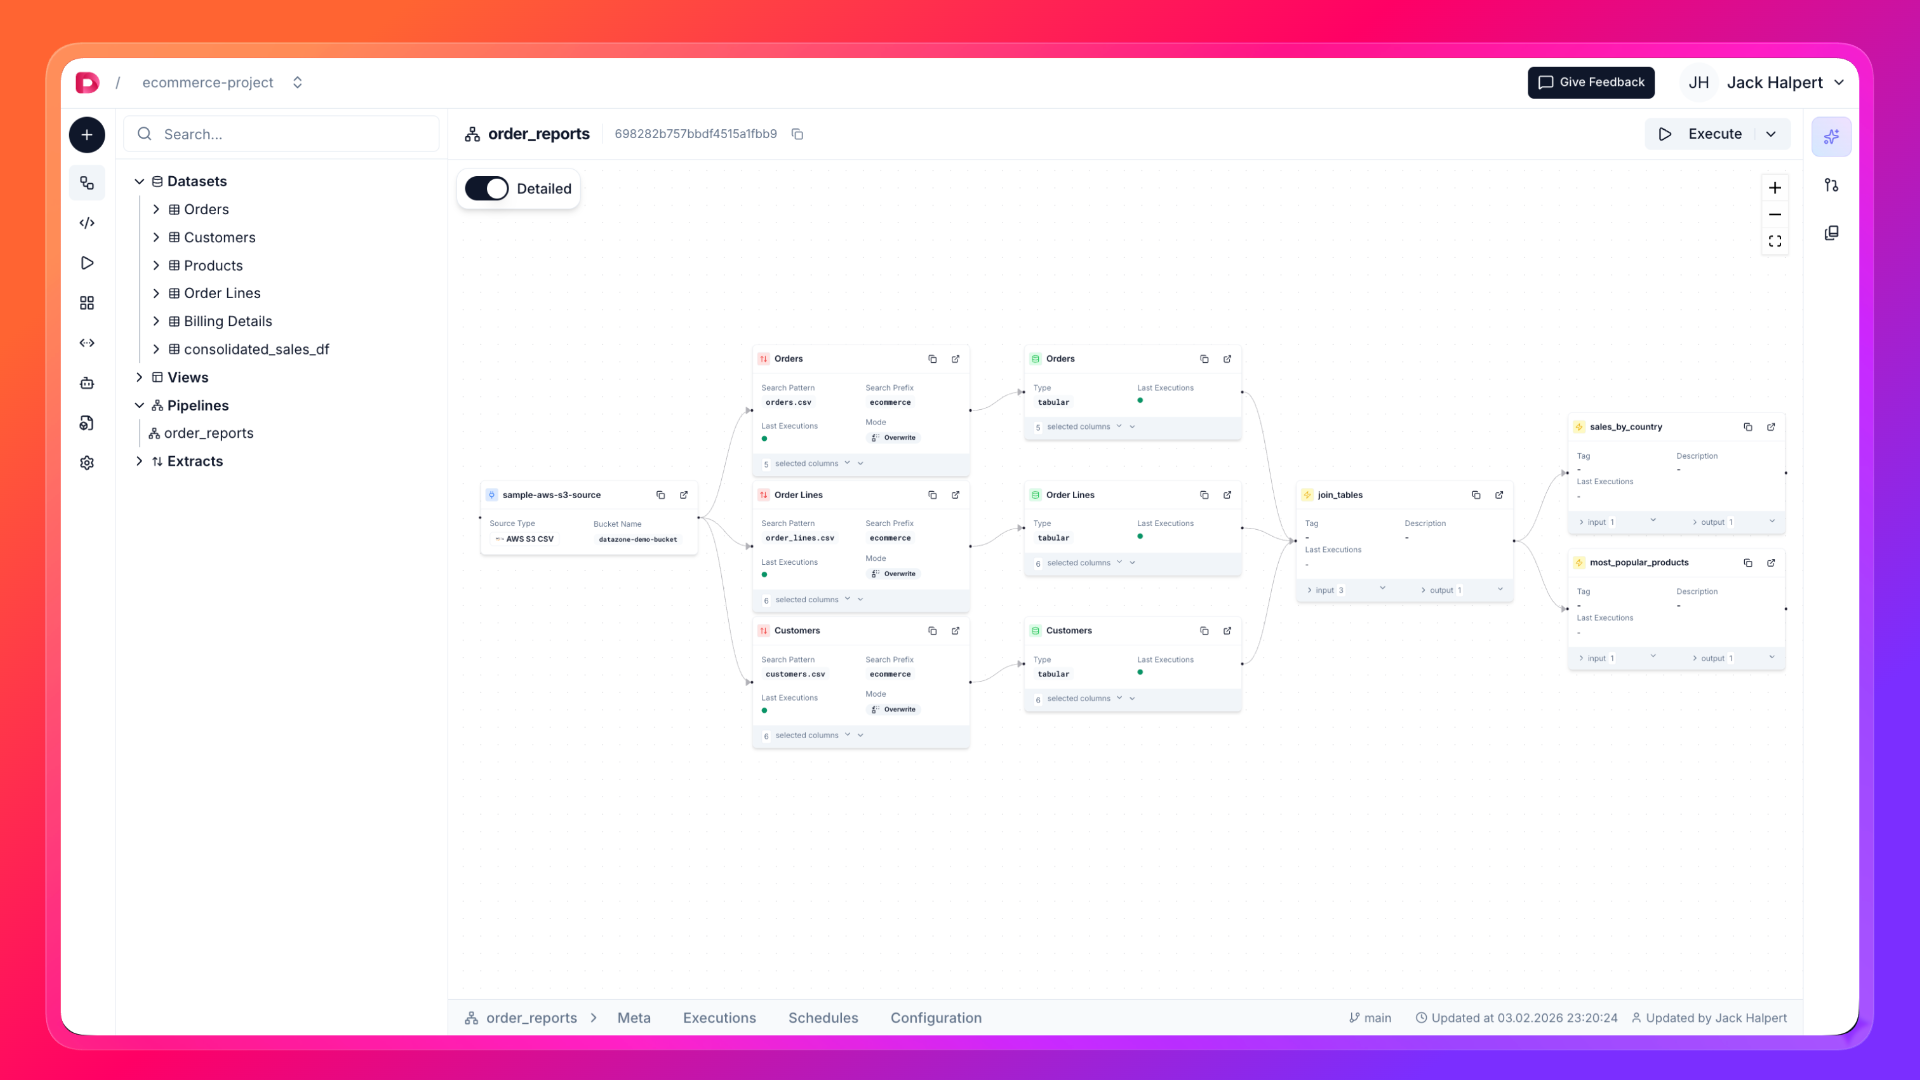 1. Click the Execute button in the pipeline page.
There are many ways to do something in Datazone. You can run your pipeline via
UI, CLI or API.
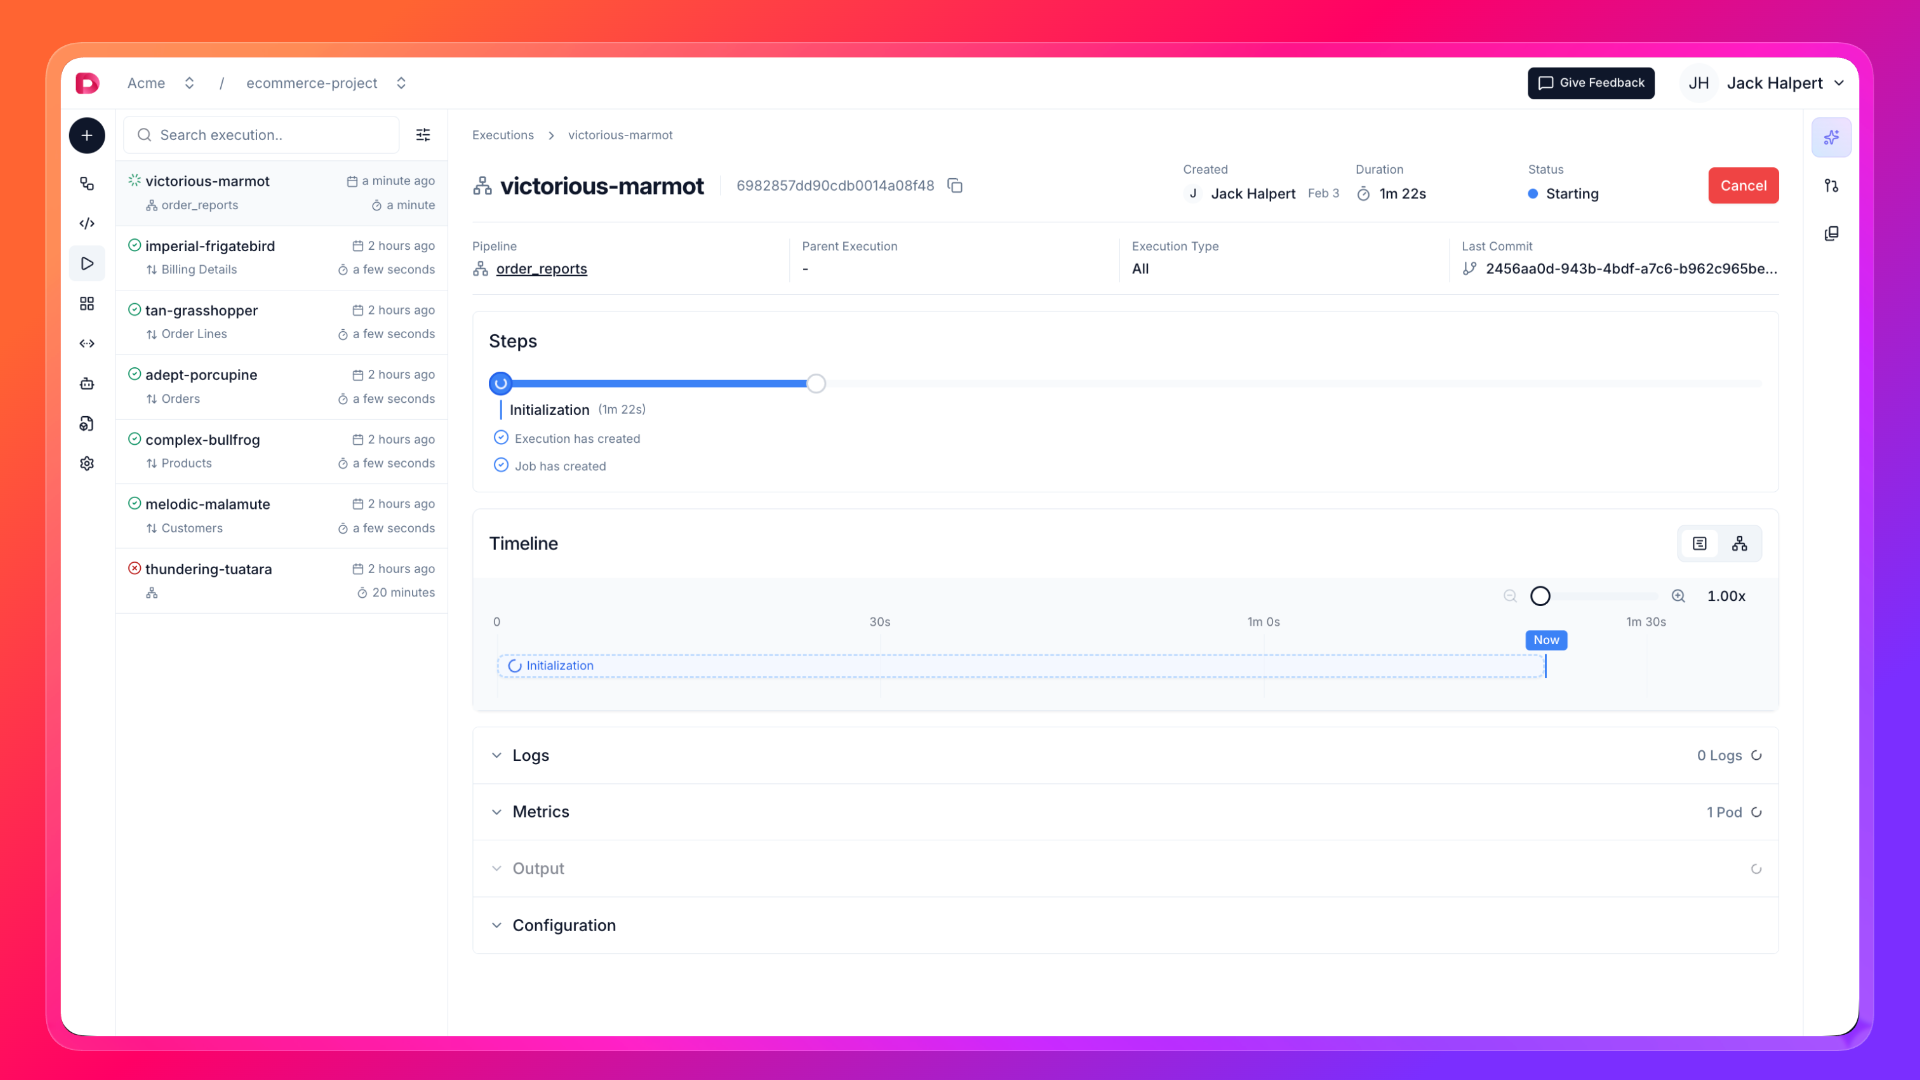
1. While execution is running, you can check the logs both in the terminal and in the UI.
After the execution is completed, you can check the logs and the output dataset in the **Executions** tab.
1. Click the Execute button in the pipeline page.
There are many ways to do something in Datazone. You can run your pipeline via
UI, CLI or API.
1. While execution is running, you can check the logs both in the terminal and in the UI.
After the execution is completed, you can check the logs and the output dataset in the **Executions** tab.
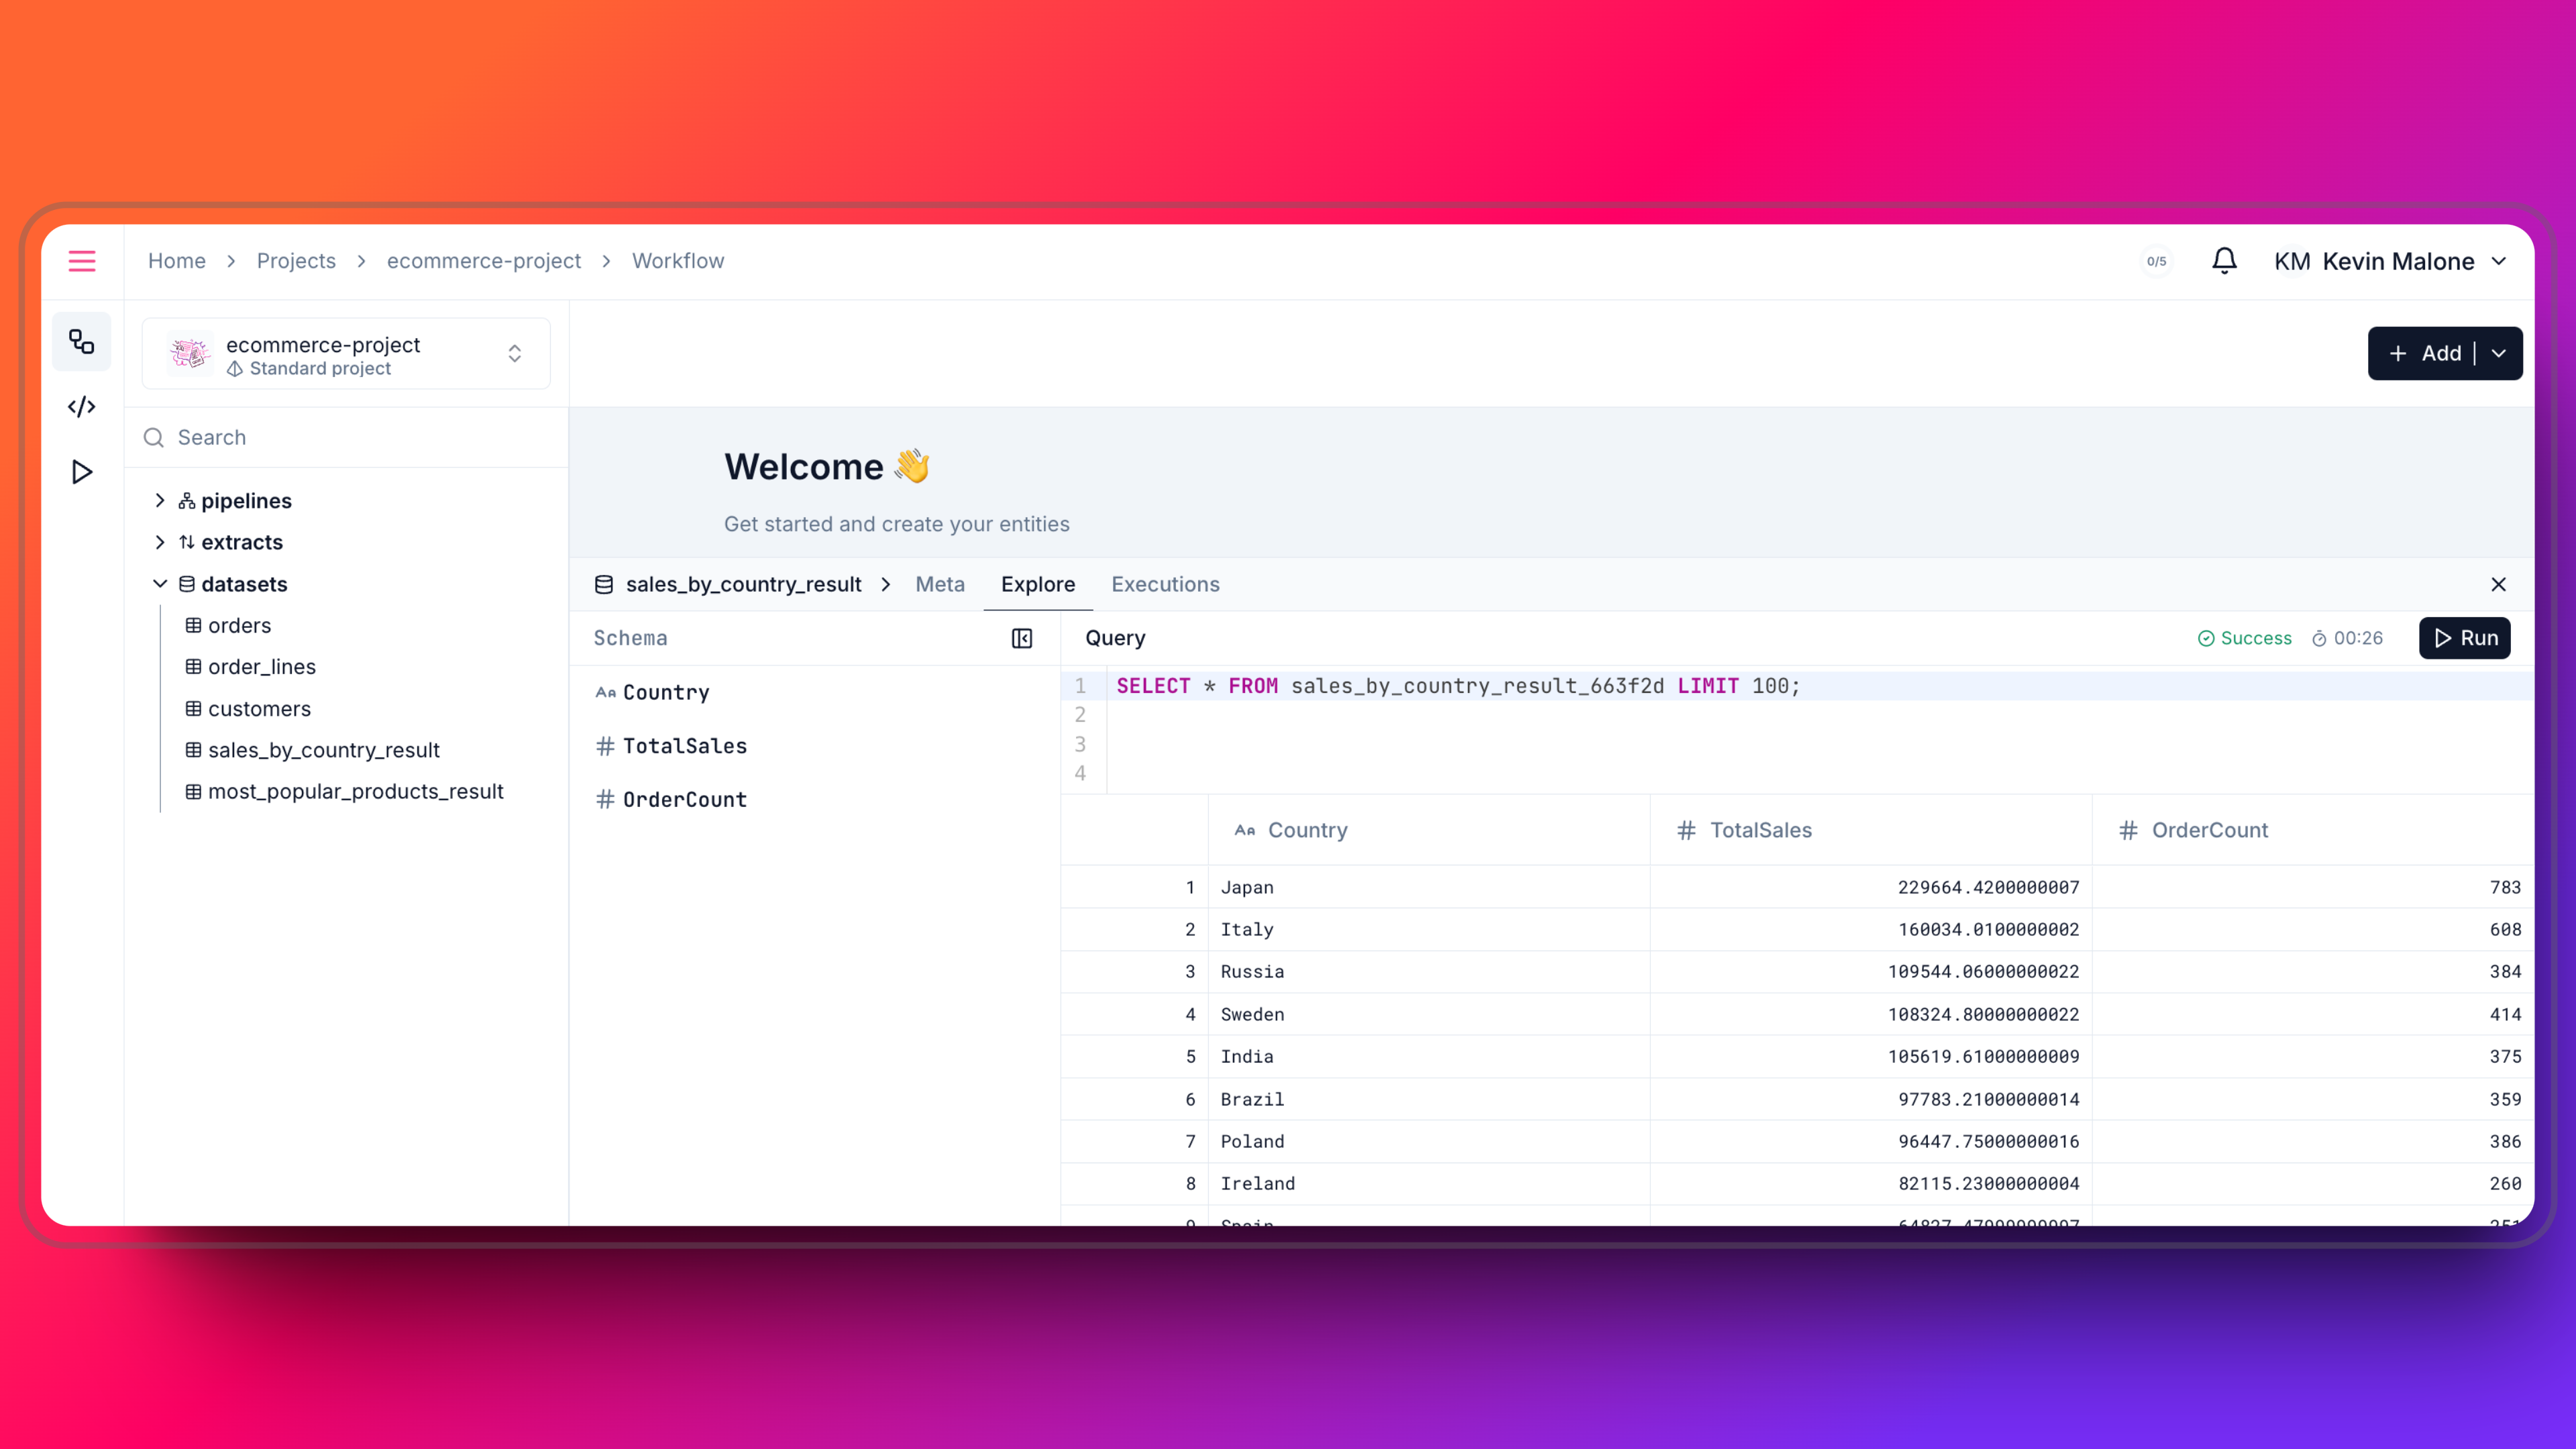
 1. Our new **Dataset** is ready to use. You can check and explore the data in the dataset drawer.
 ## ⏰ Orchestrate Your Pipeline
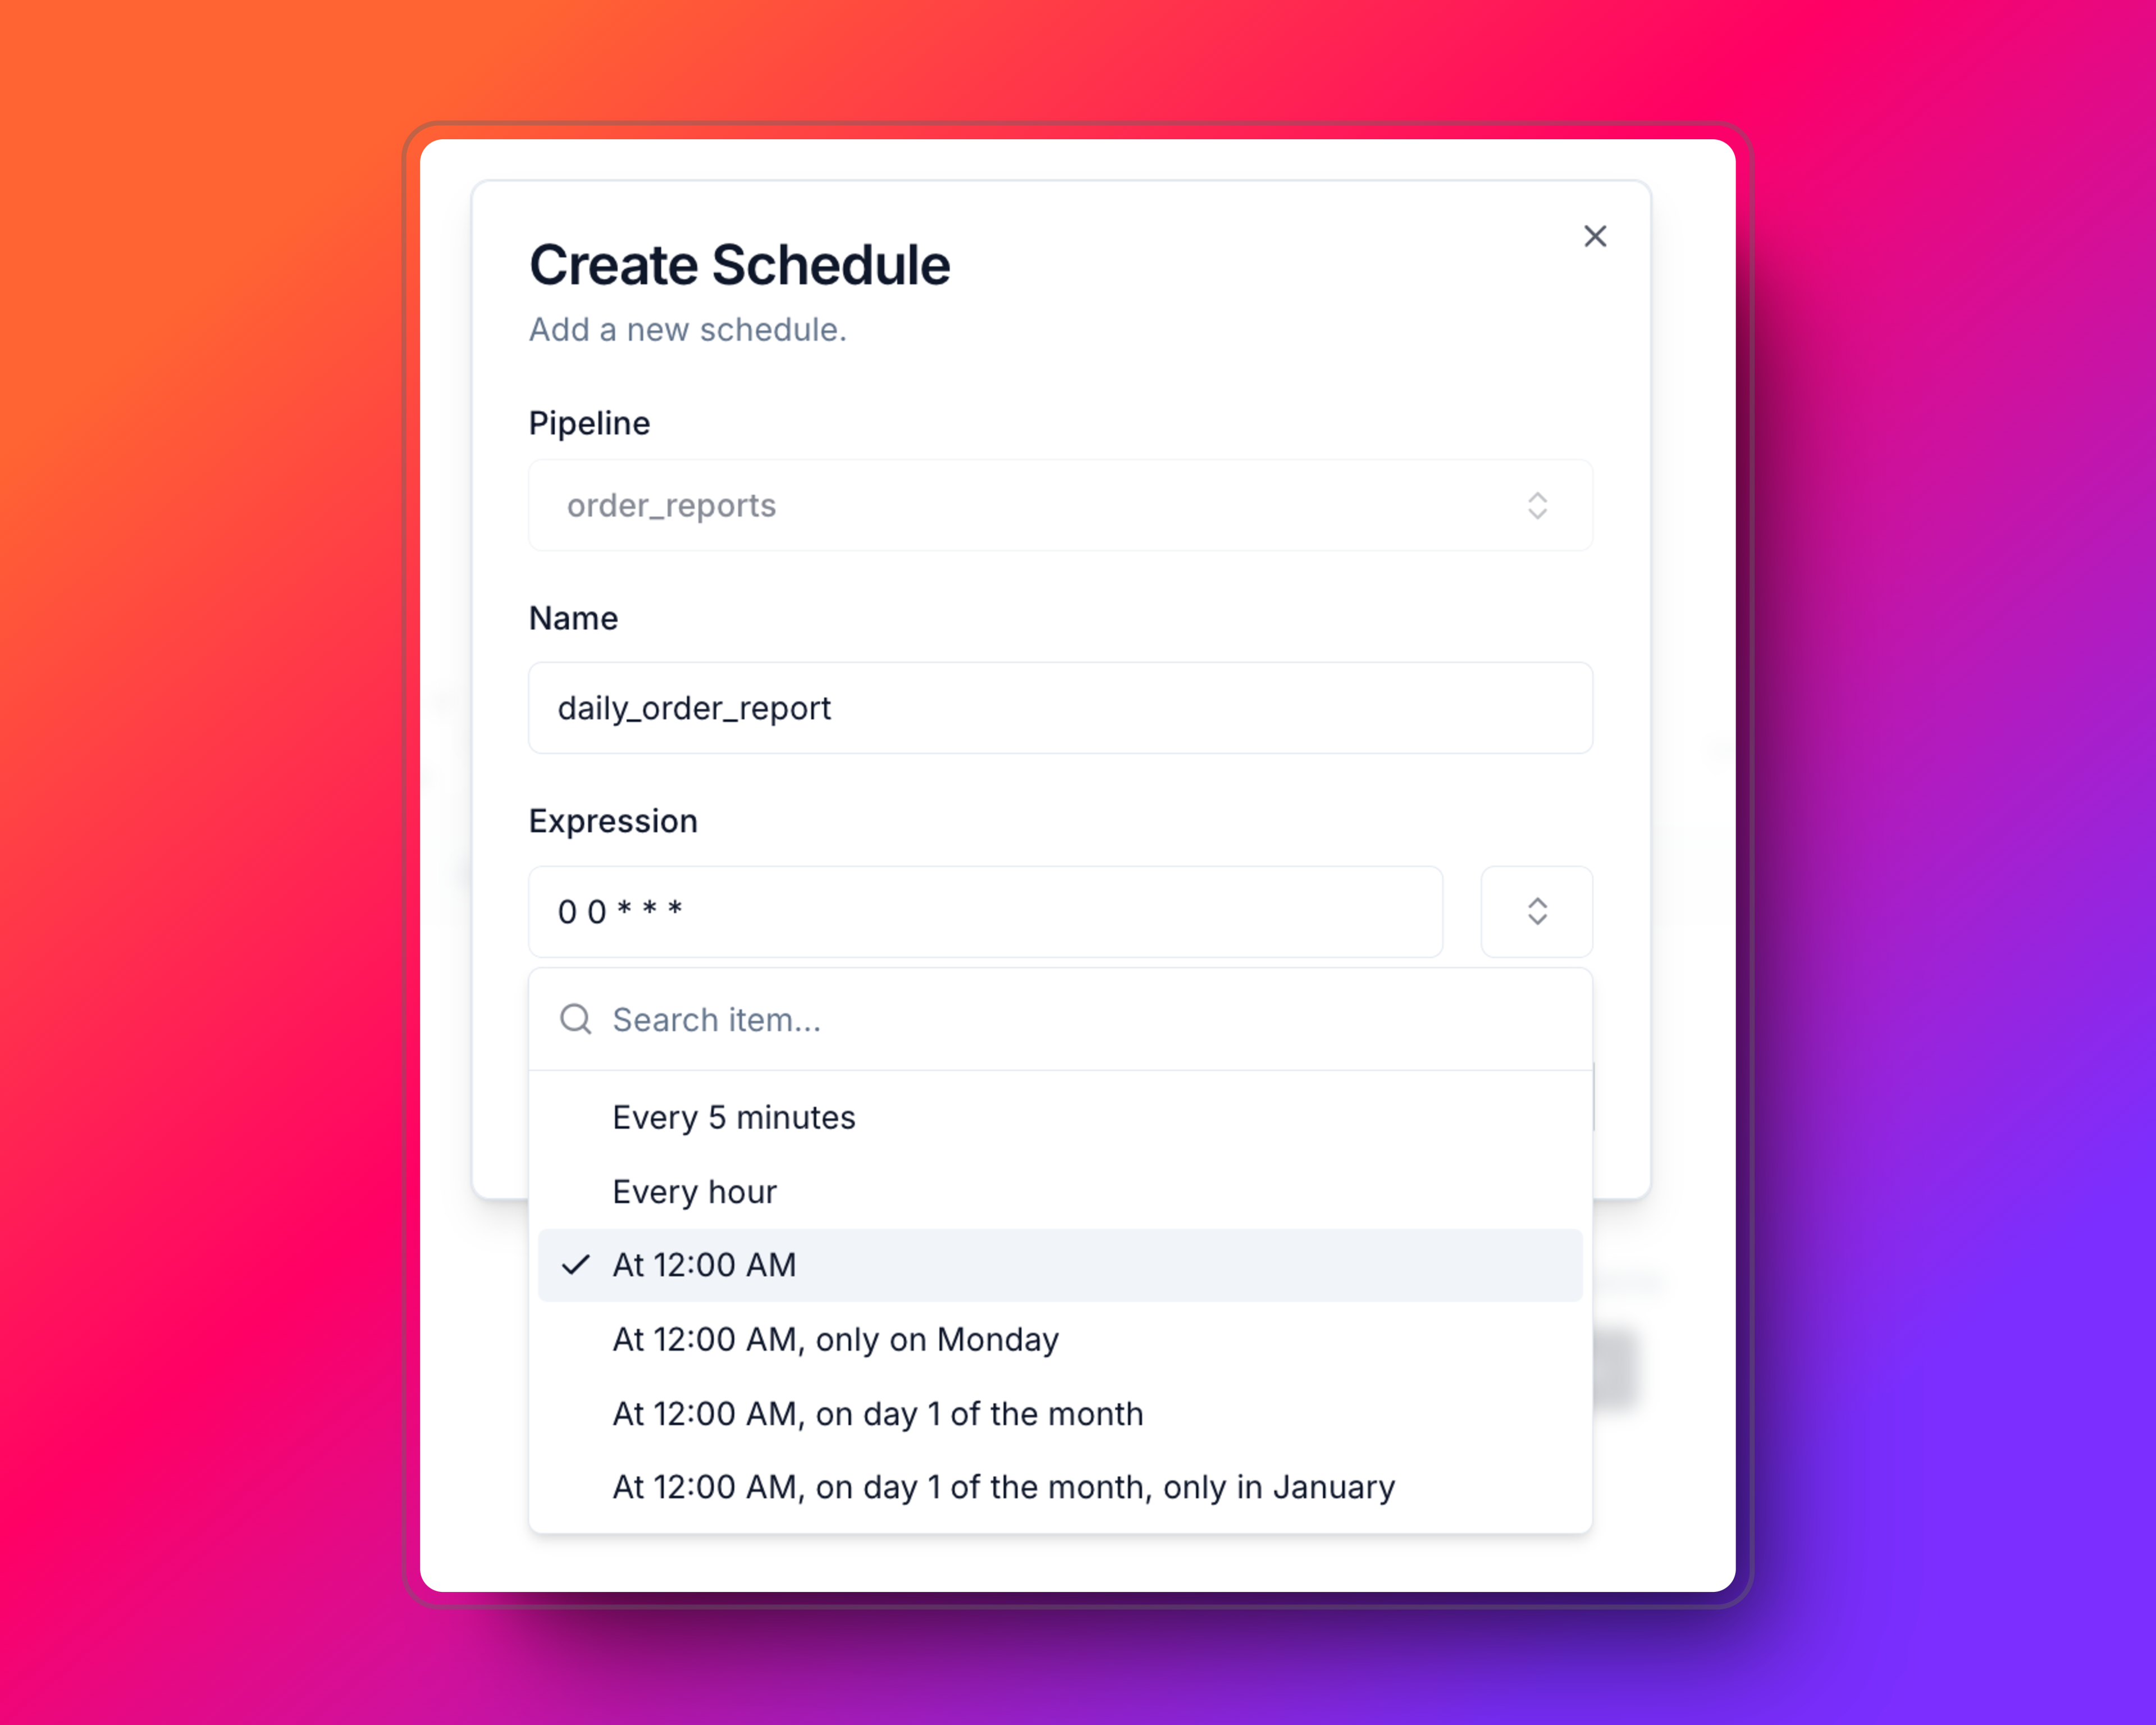
1. Select the pipeline you want to schedule in the Explorer.
2. Open the **Schedules** tab and click on the **+ Set Schedule** button.
3. Attributes are:
* `pipeline`: The pipeline you want to schedule. (It is already selected)
* `name`: The name of the schedule.
* `expression`: The cron expression for the schedule. You can use the presets or write your own.
## ⏰ Orchestrate Your Pipeline
1. Select the pipeline you want to schedule in the Explorer.
2. Open the **Schedules** tab and click on the **+ Set Schedule** button.
3. Attributes are:
* `pipeline`: The pipeline you want to schedule. (It is already selected)
* `name`: The name of the schedule.
* `expression`: The cron expression for the schedule. You can use the presets or write your own.
 ## 🧠 Create an Intelligent App
At this point, your pipelines are producing reliable and structured datasets.
In Datazone, an Intelligent App is built on top of these pipelines to turn data into **context-aware applications**.
An Intelligent App can:
* Observe changes in datasets over time
* Understand relationships between entities
* Surface meaningful insights without manual queries
This layer moves your system beyond data processing and enables it to support decisions and workflows.
***
## 🤖 Deploy an Agent
Agents bring automation and intelligence into your Datazone applications.
An Agent continuously monitors selected datasets, pipelines, or executions and reacts based on context.
Typical use cases include:
* Detecting anomalies in data or execution behavior
* Monitoring pipeline health and failures
* Identifying unusual trends or patterns
* Providing proactive insights without user interaction
Once deployed, agents run continuously and become part of your production system.
***
## 🔗 Expose Data via Endpoints
After processing and enriching your data, you can expose it using Endpoints.
Endpoints allow external applications and services to securely access your datasets via APIs.
Key benefits:
* Secure access using API keys
* Controlled exposure at dataset or view level
* No direct database access required
This enables frontend applications, integrations, and services to consume trusted data safely.
## 🏆 Access the Data
### SQL Interfaces
```sql Clickhouse theme={null}
clickhouse-connect --host=app.datazone.co --port=8443 --user=your-user --password=your-password
```
```sql MySQL theme={null}
mysql -h app.datazone.co -P 3306 -u your-user -p
```
```sql PostgreSQL theme={null}
psql -h app.datazone.co -U your-user -d your-database
```
## Related Resources
Create secure, controlled API interfaces for your datasets
Generate and manage API keys for programmatic access
Connect to Datazone using Clickhouse ODBC or JDBC drivers
Transform datasets into optimized relational database structures
## 🧠 Create an Intelligent App
At this point, your pipelines are producing reliable and structured datasets.
In Datazone, an Intelligent App is built on top of these pipelines to turn data into **context-aware applications**.
An Intelligent App can:
* Observe changes in datasets over time
* Understand relationships between entities
* Surface meaningful insights without manual queries
This layer moves your system beyond data processing and enables it to support decisions and workflows.
***
## 🤖 Deploy an Agent
Agents bring automation and intelligence into your Datazone applications.
An Agent continuously monitors selected datasets, pipelines, or executions and reacts based on context.
Typical use cases include:
* Detecting anomalies in data or execution behavior
* Monitoring pipeline health and failures
* Identifying unusual trends or patterns
* Providing proactive insights without user interaction
Once deployed, agents run continuously and become part of your production system.
***
## 🔗 Expose Data via Endpoints
After processing and enriching your data, you can expose it using Endpoints.
Endpoints allow external applications and services to securely access your datasets via APIs.
Key benefits:
* Secure access using API keys
* Controlled exposure at dataset or view level
* No direct database access required
This enables frontend applications, integrations, and services to consume trusted data safely.
## 🏆 Access the Data
### SQL Interfaces
```sql Clickhouse theme={null}
clickhouse-connect --host=app.datazone.co --port=8443 --user=your-user --password=your-password
```
```sql MySQL theme={null}
mysql -h app.datazone.co -P 3306 -u your-user -p
```
```sql PostgreSQL theme={null}
psql -h app.datazone.co -U your-user -d your-database
```
## Related Resources
Create secure, controlled API interfaces for your datasets
Generate and manage API keys for programmatic access
Connect to Datazone using Clickhouse ODBC or JDBC drivers
Transform datasets into optimized relational database structures