> ## Documentation Index
> Fetch the complete documentation index at: https://docs.datazone.co/llms.txt
> Use this file to discover all available pages before exploring further.
# Change Logs
> Release notes and feature updates for Datazone
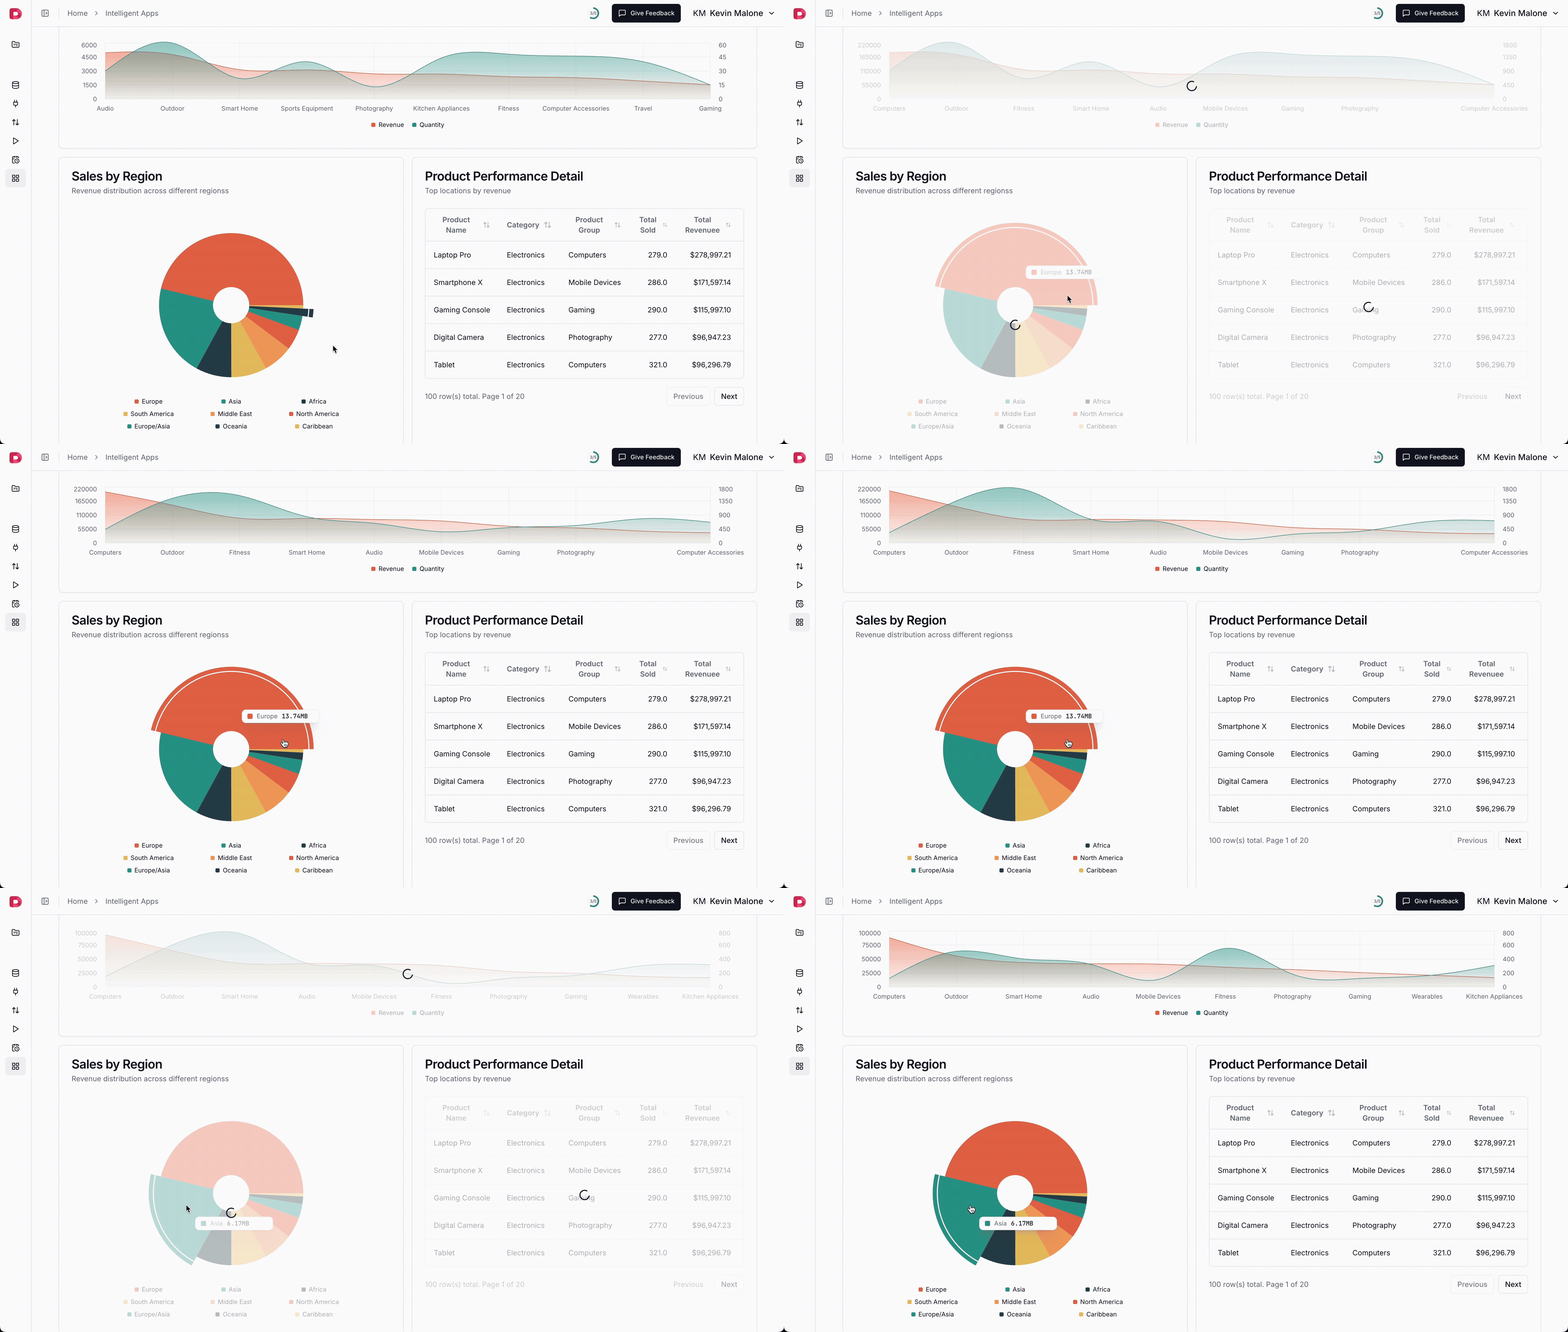
 * **[Embedded Agents](reference/agents/embedding)**: Take the agents you've built on top of your lakehouse and drop them straight into **your own apps, websites, or any third-party tool** — with **just one line of code**. The embedded agent connects to the **same data sources, tools, and model configuration** you set up in Datazone, so your users get the full conversational experience without ever leaving your product. Choose between **Full**, **Bot**, or **Drawer** widget styles, and generate a secure, signed snippet right from the **Embedding** tab of any agent.
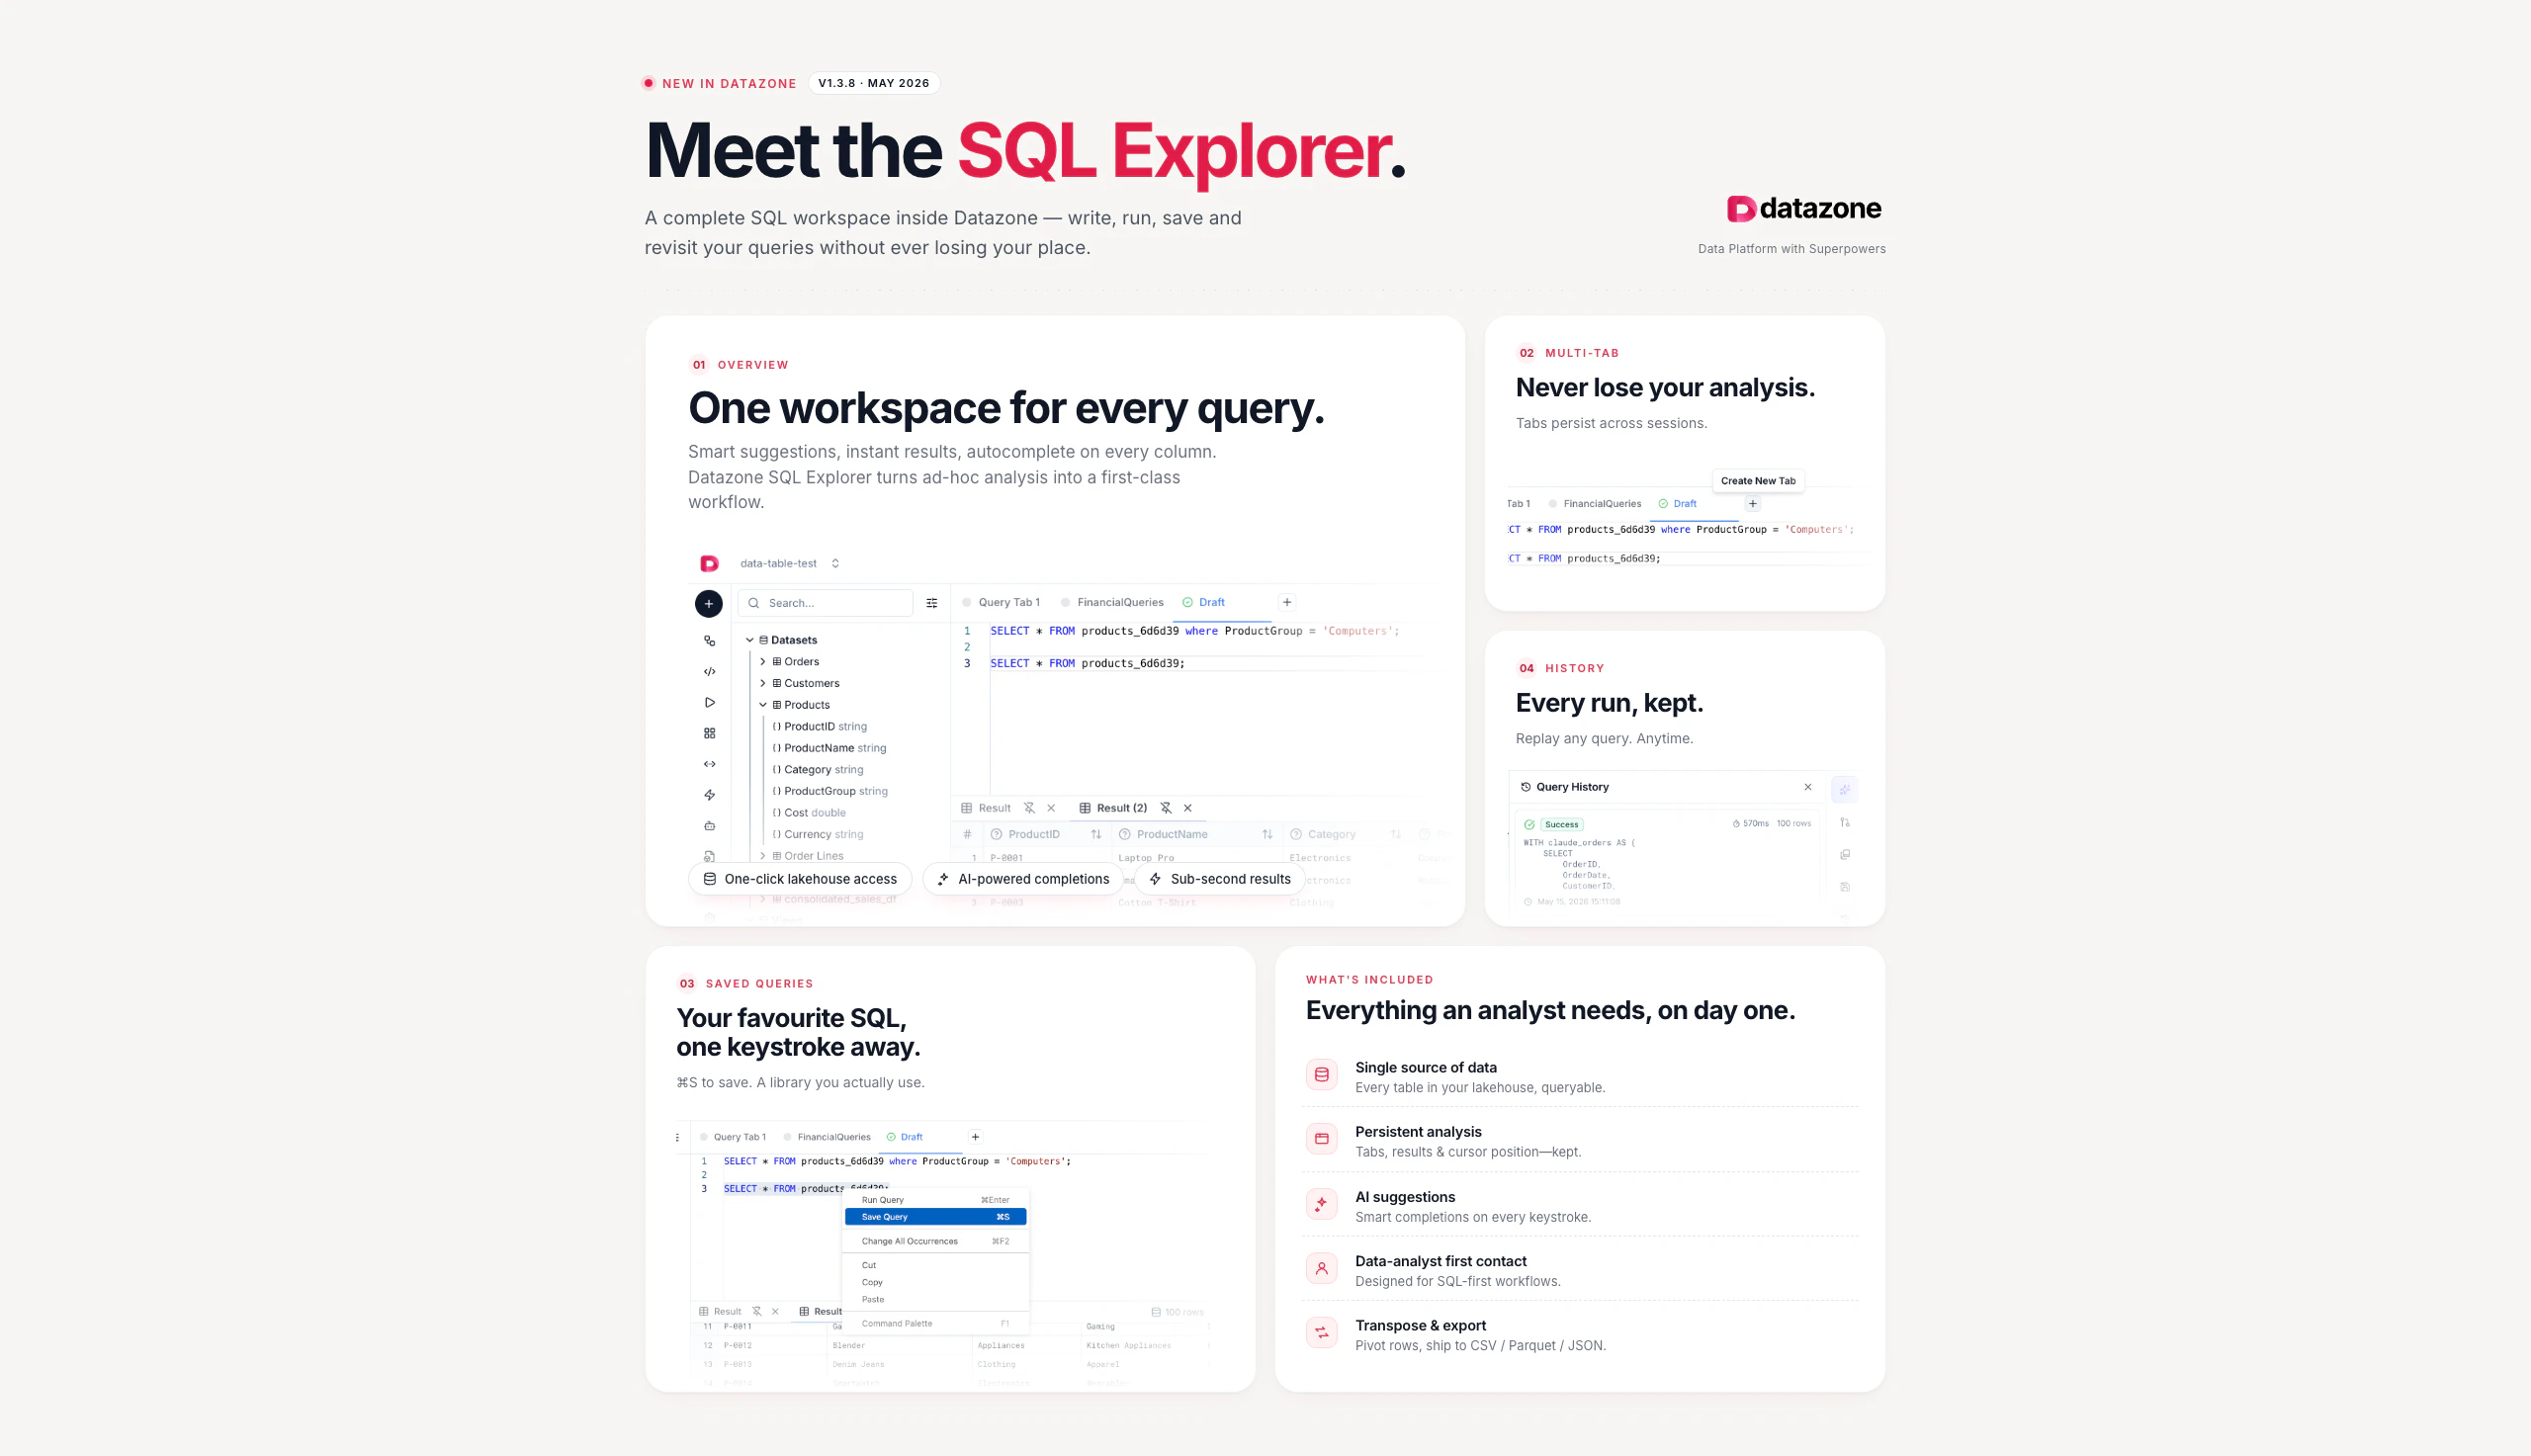
* **SQL Explorer**: A complete SQL workspace inside Datazone — **write, run, save, and revisit** your queries without ever losing your place. Get **AI-powered autocomplete** on every column, **sub-second results**, and **one-click access** to every table in your lakehouse. Work across **multiple tabs** that persist between sessions, save your favourite queries to a reusable library, and **replay any past run** from query history. Built for **SQL-first analyst workflows**, with transpose and export to CSV, Parquet, or JSON.
* **[Embedded Agents](reference/agents/embedding)**: Take the agents you've built on top of your lakehouse and drop them straight into **your own apps, websites, or any third-party tool** — with **just one line of code**. The embedded agent connects to the **same data sources, tools, and model configuration** you set up in Datazone, so your users get the full conversational experience without ever leaving your product. Choose between **Full**, **Bot**, or **Drawer** widget styles, and generate a secure, signed snippet right from the **Embedding** tab of any agent.
* **SQL Explorer**: A complete SQL workspace inside Datazone — **write, run, save, and revisit** your queries without ever losing your place. Get **AI-powered autocomplete** on every column, **sub-second results**, and **one-click access** to every table in your lakehouse. Work across **multiple tabs** that persist between sessions, save your favourite queries to a reusable library, and **replay any past run** from query history. Built for **SQL-first analyst workflows**, with transpose and export to CSV, Parquet, or JSON.
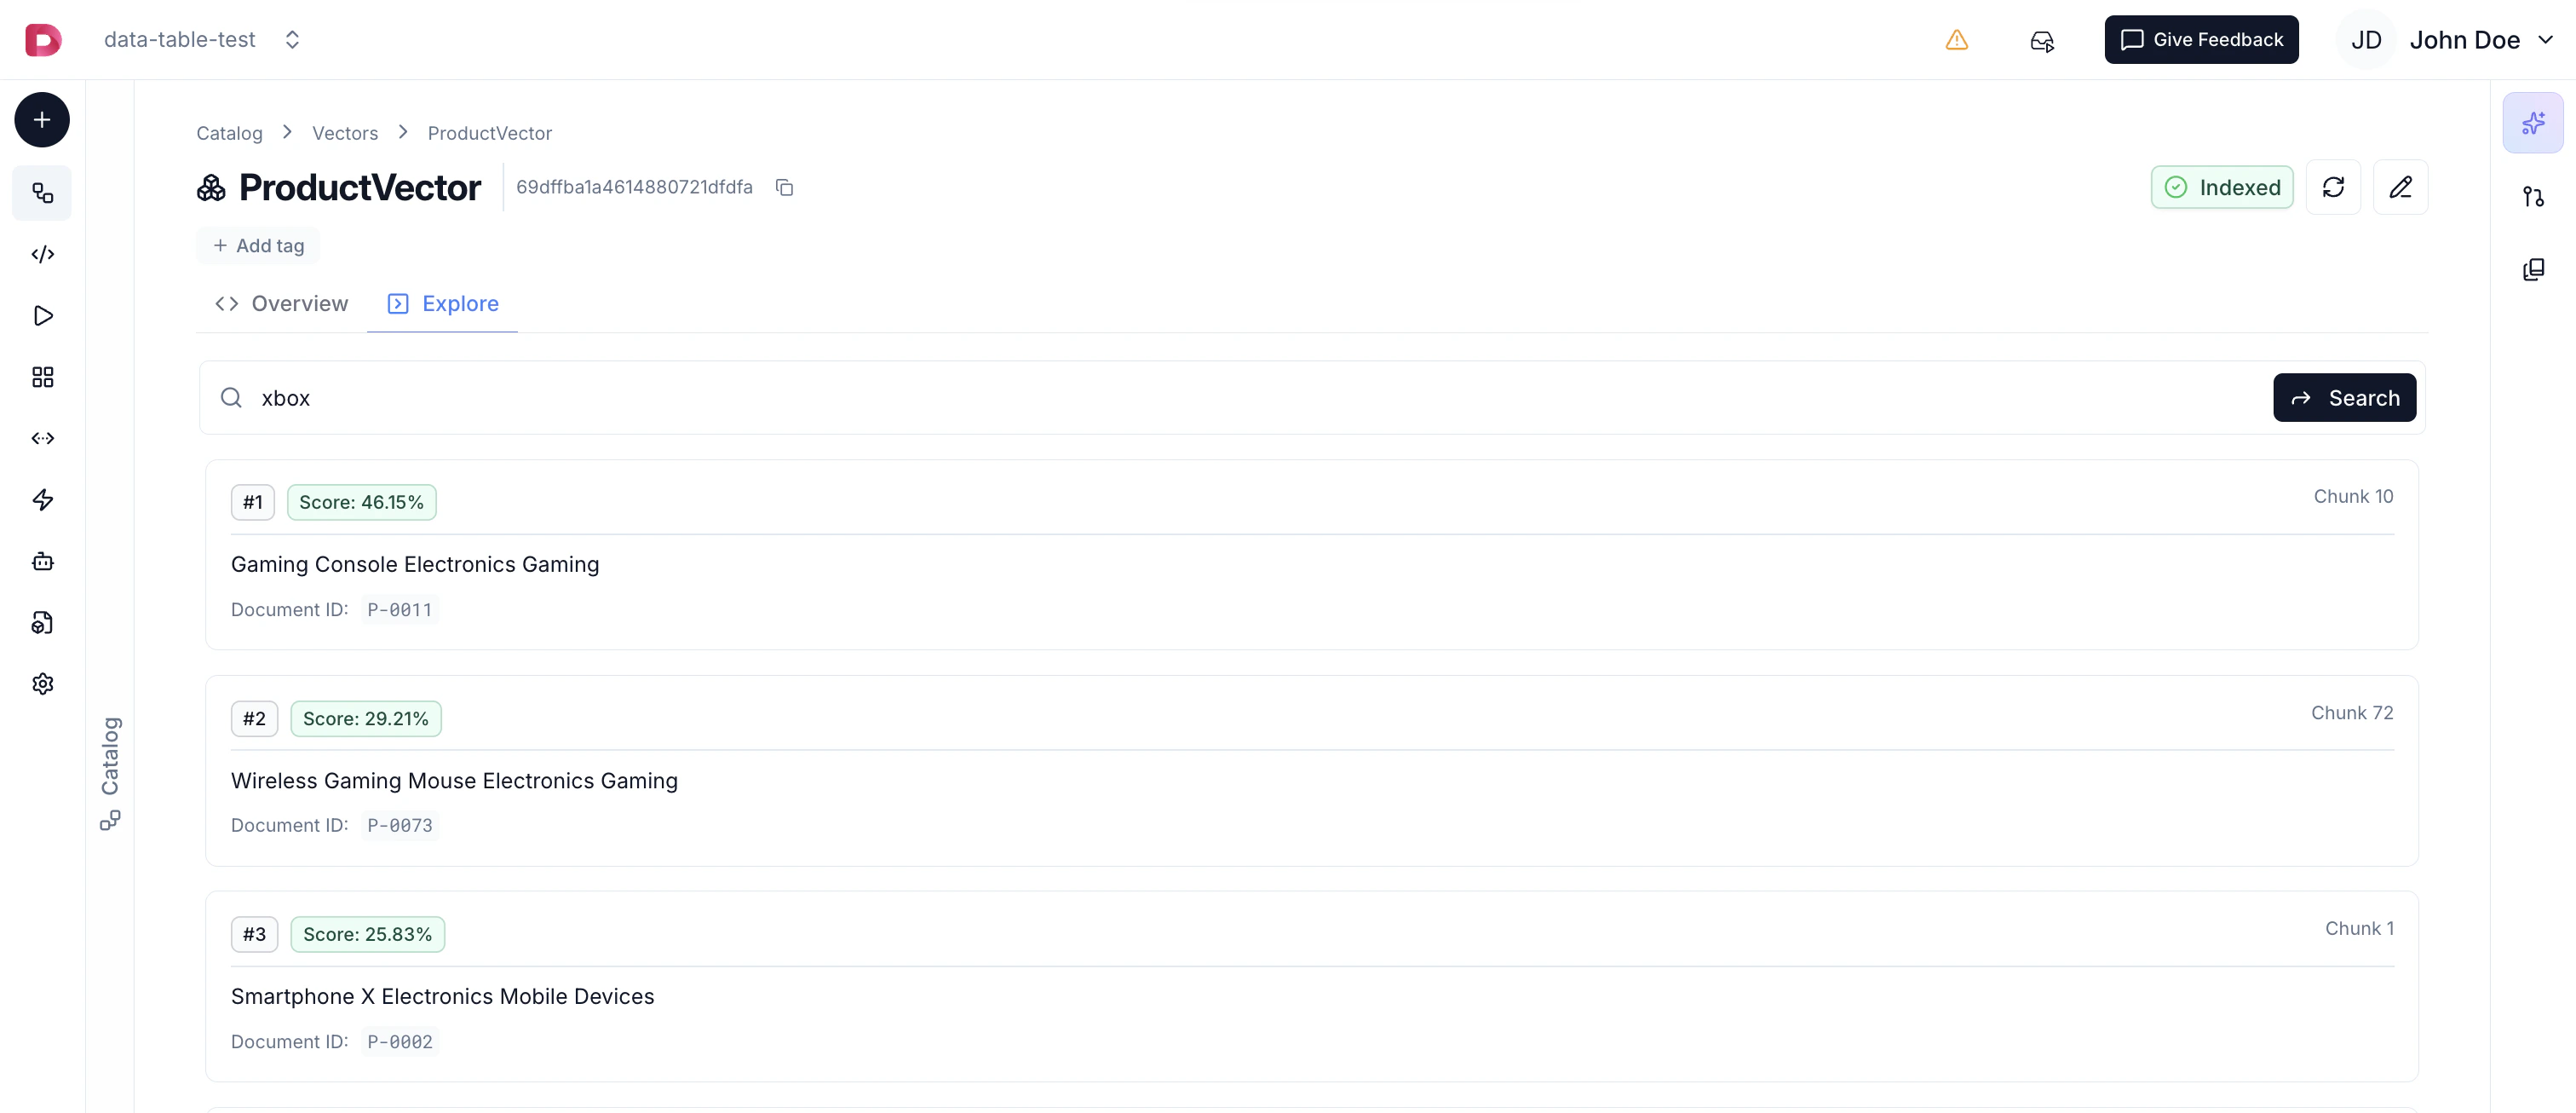
 * **[Vectors](reference/development/vectors)**: Transform your data into searchable embeddings for AI-powered applications. Create vector indexes from datasets or file containers, configure embedding models and chunking strategies, and enable semantic search that understands meaning and context. Attach vectors to [Agents](reference/agents/overview) for RAG-powered conversations or create [Vector Endpoints](reference/integration/endpoints#vector-based-endpoints) to build semantic search backends for your applications.
 * **[Dynamic Chart Inputs](reference/intelligent-apps/components#dynamic-charts-with-chart-inputs)**: Add interactive dropdown controls directly to charts for dynamic query modification. Users can switch dimensions, change grouping levels, or adjust filters without leaving the chart view. Works seamlessly with Jinja templating for powerful, flexible visualizations.
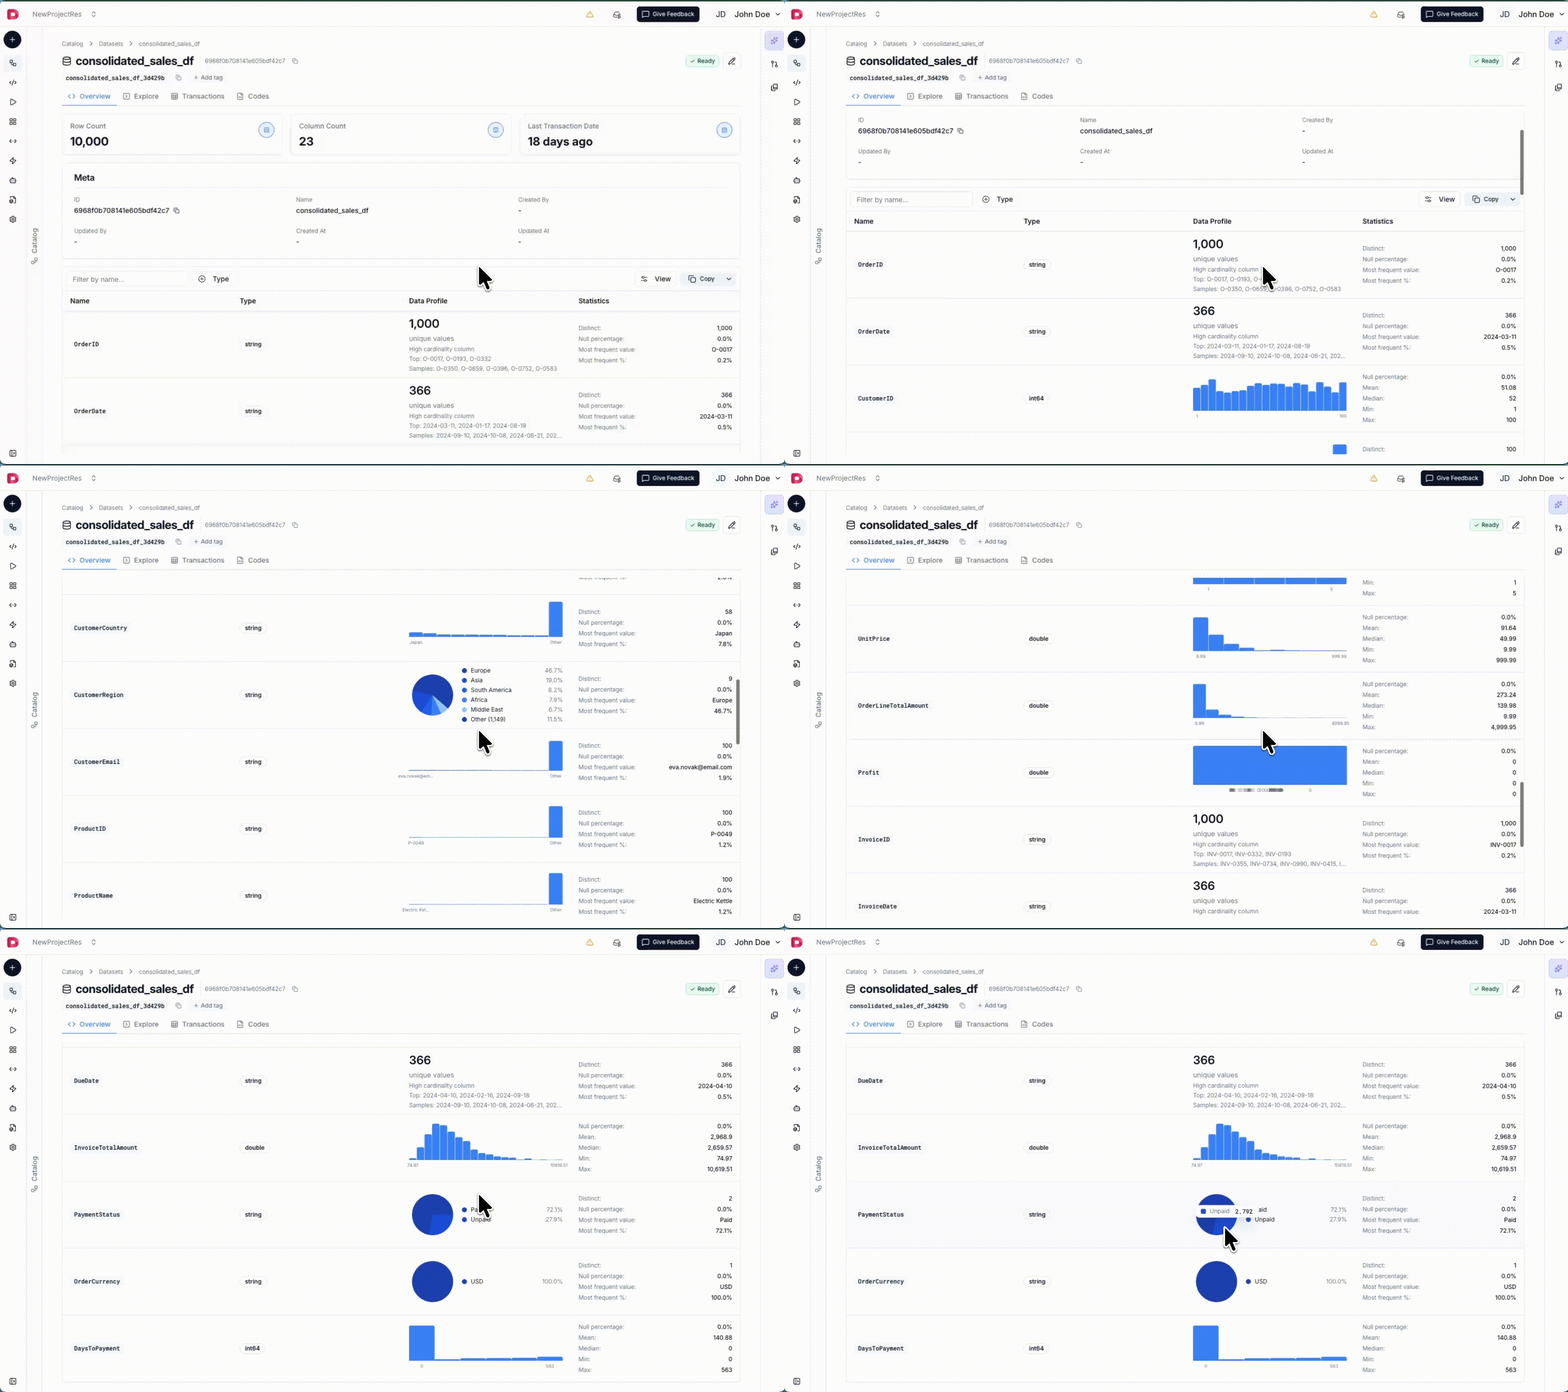
* **Data Profiling**: Understand your data at a glance without manual exploration. Data profiling automatically analyzes your datasets and views, revealing key insights through visual charts. For categorical columns, see value distribution with histograms and pie charts. For numeric columns, view statistical metrics like average and standard deviation. Get instant visibility into your data's characteristics.
* **[Dynamic Chart Inputs](reference/intelligent-apps/components#dynamic-charts-with-chart-inputs)**: Add interactive dropdown controls directly to charts for dynamic query modification. Users can switch dimensions, change grouping levels, or adjust filters without leaving the chart view. Works seamlessly with Jinja templating for powerful, flexible visualizations.
* **Data Profiling**: Understand your data at a glance without manual exploration. Data profiling automatically analyzes your datasets and views, revealing key insights through visual charts. For categorical columns, see value distribution with histograms and pie charts. For numeric columns, view statistical metrics like average and standard deviation. Get instant visibility into your data's characteristics.
 * **[Channels](reference/platform/channels)**: Integrate Datazone with external communication platforms. Configure Slack or email channels to deliver scheduled reports and notifications to your team.
* **[Reports](reference/platform/reports)**: Automate Intelligent App delivery on a schedule. Generate reports as PDF or PNG and send them via Slack or email using cron expressions for flexible scheduling.
* **[Quotas](reference/platform/resources/quotas)**: Set resource limits to control costs and prevent unexpected usage. Create quotas for DCU, tokens, storage, queries, and actions. Get email notifications at 80% usage and automatic service pause at 100% to stay in control of consumption.
* **[Channels](reference/platform/channels)**: Integrate Datazone with external communication platforms. Configure Slack or email channels to deliver scheduled reports and notifications to your team.
* **[Reports](reference/platform/reports)**: Automate Intelligent App delivery on a schedule. Generate reports as PDF or PNG and send them via Slack or email using cron expressions for flexible scheduling.
* **[Quotas](reference/platform/resources/quotas)**: Set resource limits to control costs and prevent unexpected usage. Create quotas for DCU, tokens, storage, queries, and actions. Get email notifications at 80% usage and automatic service pause at 100% to stay in control of consumption.
 * **[Actions](reference/development/actions)**: Deploy **serverless Python functions** that execute on-demand via **API endpoints** or as **tools for AI agents**. Write custom logic with the `@action` decorator, use the **context API** for logging, and automate workflows like **sending notifications**, **processing data**, or **calling external APIs**.
 * **[Datazone Agents](reference/agents/overview)**: Create **custom AI assistants** that interact with your data through **natural language**. Agents can execute **SQL queries**, run **Python code**, generate **charts**, and **search the web** automatically. Supports **multiple languages** and remembers **conversation context** for intelligent, multi-step analysis.
* **[Model Accounts](reference/development/model-accounts)**: Securely manage **AI provider credentials** for **OpenAI**, **Anthropic (Claude)**, and **AWS Bedrock**. Configure once and reuse across projects and agents with **encrypted storage** and **organization-level access control**.
* **[Datazone Agents](reference/agents/overview)**: Create **custom AI assistants** that interact with your data through **natural language**. Agents can execute **SQL queries**, run **Python code**, generate **charts**, and **search the web** automatically. Supports **multiple languages** and remembers **conversation context** for intelligent, multi-step analysis.
* **[Model Accounts](reference/development/model-accounts)**: Securely manage **AI provider credentials** for **OpenAI**, **Anthropic (Claude)**, and **AWS Bedrock**. Configure once and reuse across projects and agents with **encrypted storage** and **organization-level access control**.
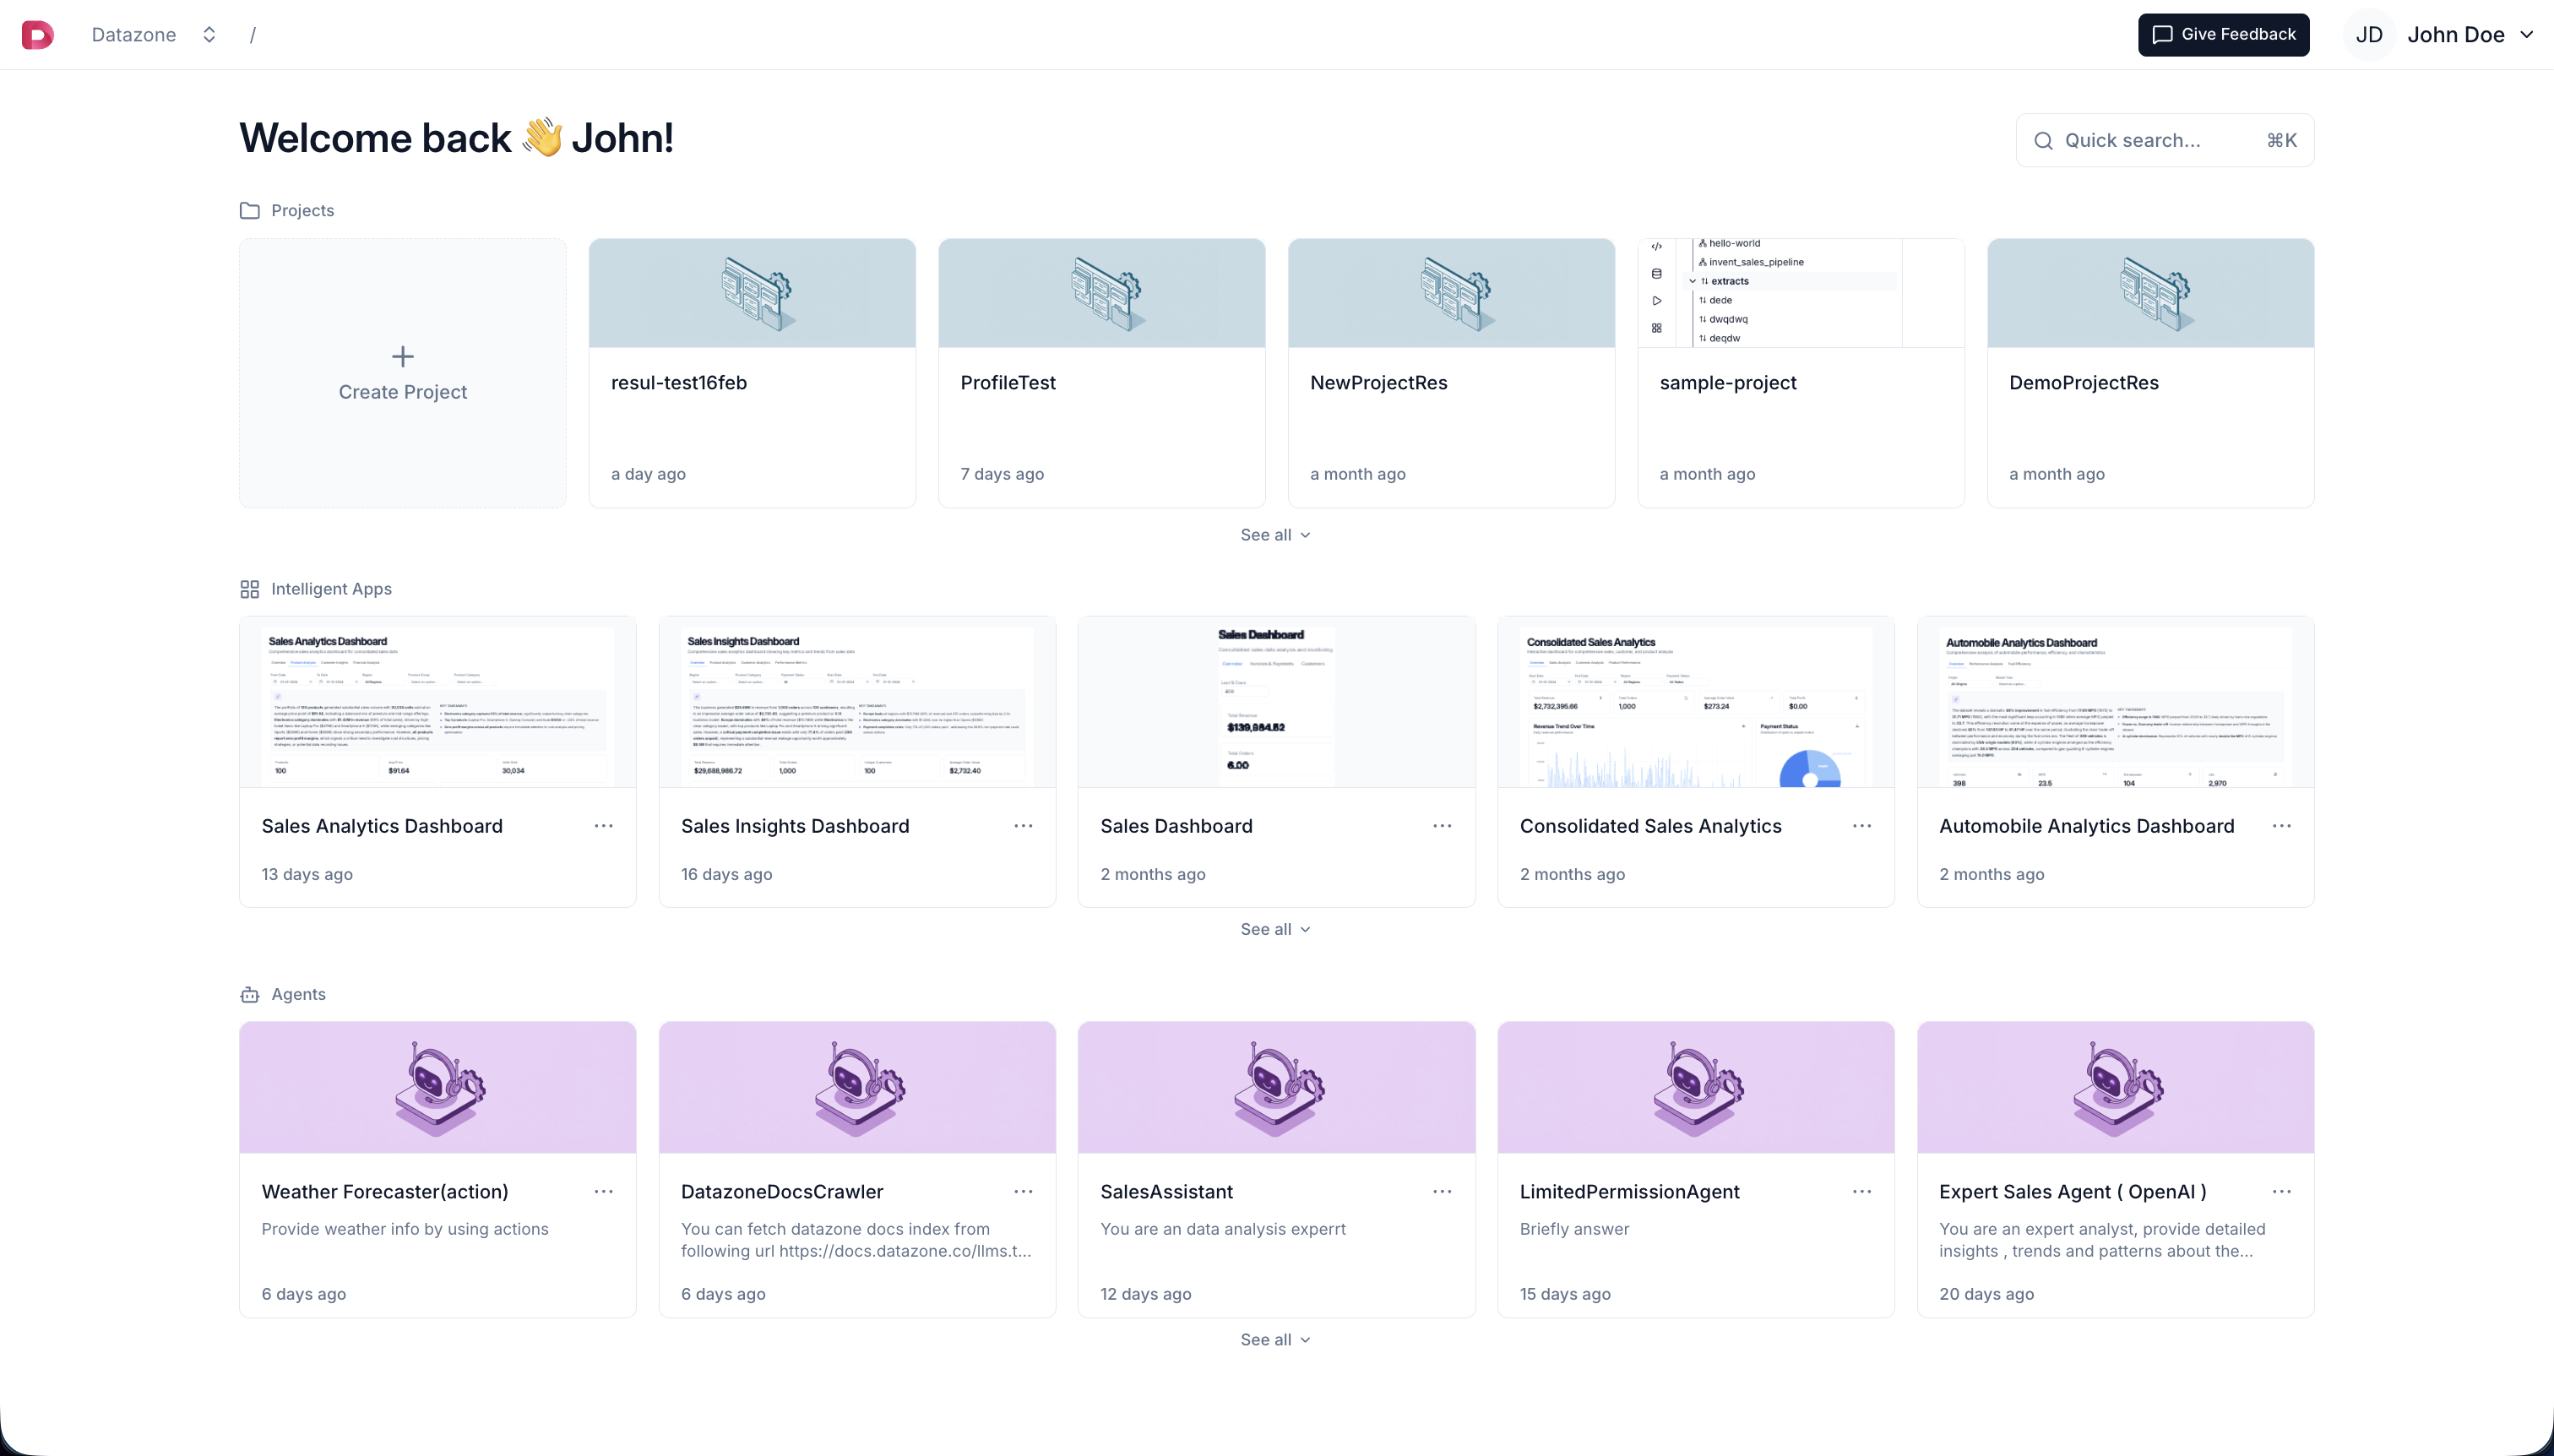 * **[New Clear Layout](reference/ui-overview)**: Redesigned interface with **card-based home page**, **streamlined project workspace**, and **⌘K quick search** for instant navigation to any resource from anywhere in the app.
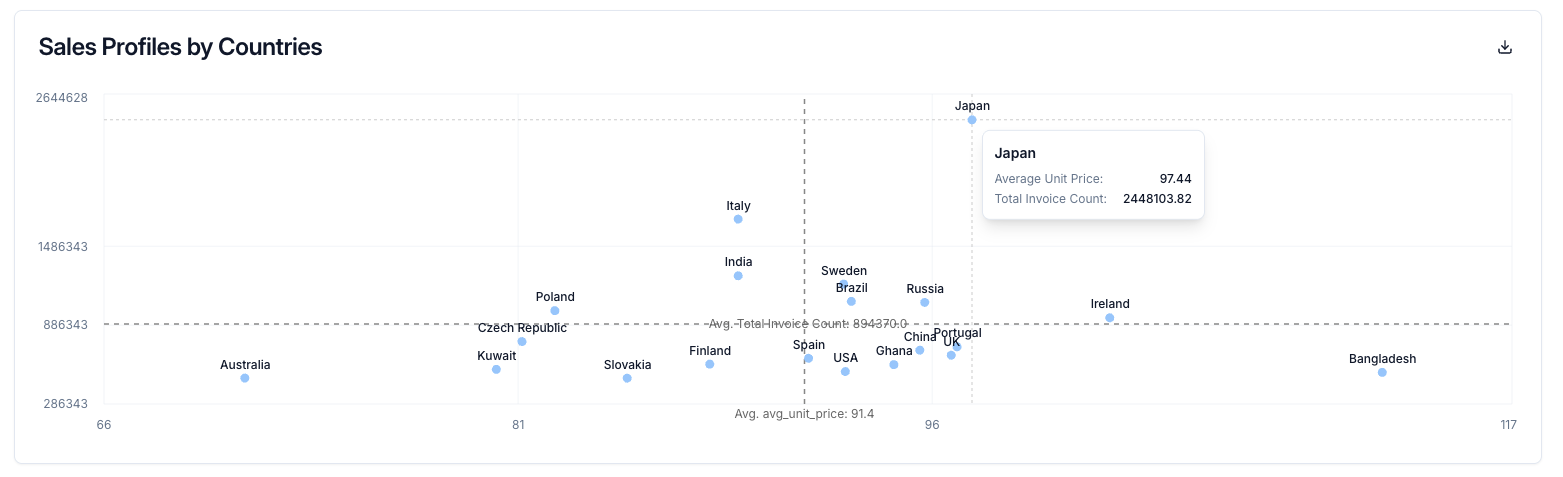 * **[Scatter Plot Chart Type](reference/intelligent-apps/components#scatter-plot-charts)**: Introduced a new scatter plot chart type for visualizing relationships between two numerical variables. Each point represents a data record positioned according to two metrics on the x and y axes, ideal for identifying correlations, patterns, or outliers in your data.
* **[Custom Theme Styling](reference/intelligent-apps/yaml-reference#custom-style-attributes)**: Added `custom_style_attributes` for advanced theme customization. Override specific theme colors using Tailwind CSS variables in HSL format, giving you fine-grained control over backgrounds, foregrounds, and chart color palettes.
* **[Conditional Chart Visibility](reference/intelligent-apps/yaml-reference#example-conditional-chart-visibility)**: Added `hide_expression` to `chart_config`, allowing you to conditionally hide charts based on query results. Use JavaScript expressions to control chart visibility dynamically (e.g., hide charts with insufficient data).
* **[Scatter Plot Chart Type](reference/intelligent-apps/components#scatter-plot-charts)**: Introduced a new scatter plot chart type for visualizing relationships between two numerical variables. Each point represents a data record positioned according to two metrics on the x and y axes, ideal for identifying correlations, patterns, or outliers in your data.
* **[Custom Theme Styling](reference/intelligent-apps/yaml-reference#custom-style-attributes)**: Added `custom_style_attributes` for advanced theme customization. Override specific theme colors using Tailwind CSS variables in HSL format, giving you fine-grained control over backgrounds, foregrounds, and chart color palettes.
* **[Conditional Chart Visibility](reference/intelligent-apps/yaml-reference#example-conditional-chart-visibility)**: Added `hide_expression` to `chart_config`, allowing you to conditionally hide charts based on query results. Use JavaScript expressions to control chart visibility dynamically (e.g., hide charts with insufficient data).
 * **[Policy System](reference/development/policy)**: Introduced a comprehensive role-based access control system with hierarchical permissions! Define fine-grained access policies with support for **flat and hierarchical resource patterns** (e.g., `project::*`), explicit allow/deny rules, and resource-specific constraints. Policies support wildcards for flexible matching, branch-aware permissions, and extra constraints like **row-level security** for views and **path restrictions** for projects. Bind policies to roles for scalable permission management across your organization.
 * **[Views](reference/integration/views)**: Introduced a powerful new feature - Views! Transform your datasets into optimized relational database structures with advanced configurations like **partitioning, primary keys, and ordering**. Choose between **materialized views** for lightning-fast query performance or **non-materialized views** for real-time data access. Create views by replicating datasets or writing custom SQL queries that combine multiple datasets and views. Access your views through SQL interface, endpoints, and intelligent apps for enhanced performance and flexibility.
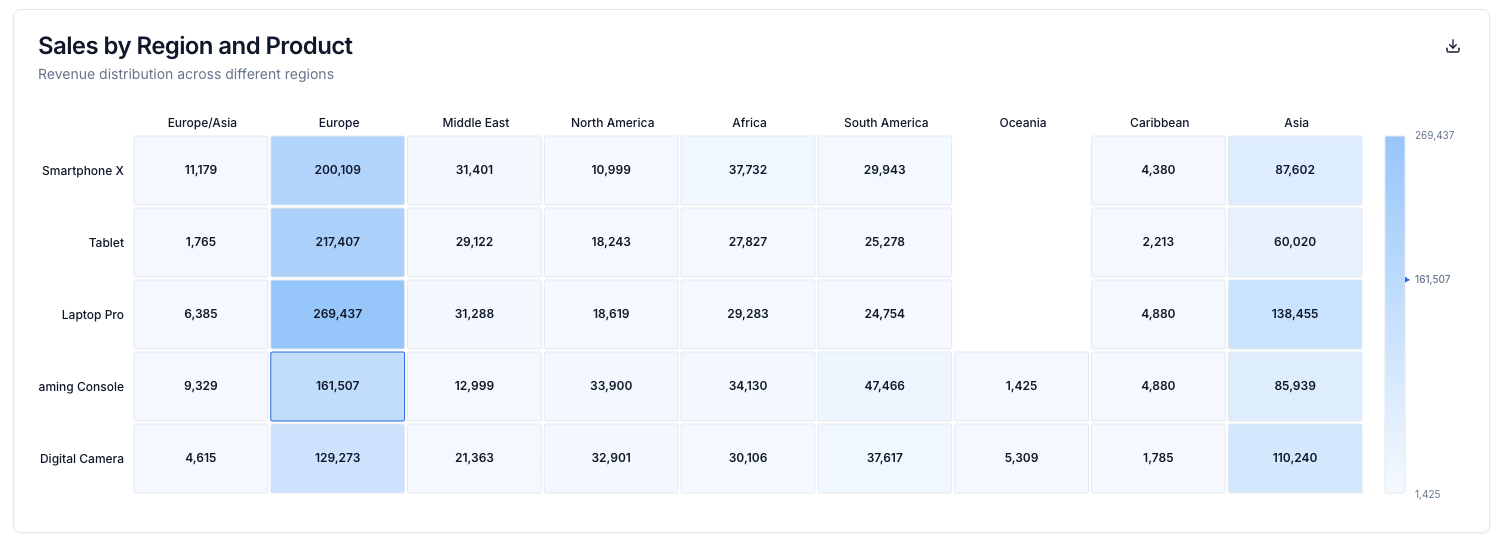
* **[Heatmap Chart Type](reference/intelligent-apps/components#heatmap-charts)**: Introduced a new heatmap chart type for visualizing data where values are represented as colors. Heatmaps require exactly two dimensions and one metric, making them perfect for showing relationships between categorical dimensions.
* **[Views](reference/integration/views)**: Introduced a powerful new feature - Views! Transform your datasets into optimized relational database structures with advanced configurations like **partitioning, primary keys, and ordering**. Choose between **materialized views** for lightning-fast query performance or **non-materialized views** for real-time data access. Create views by replicating datasets or writing custom SQL queries that combine multiple datasets and views. Access your views through SQL interface, endpoints, and intelligent apps for enhanced performance and flexibility.
* **[Heatmap Chart Type](reference/intelligent-apps/components#heatmap-charts)**: Introduced a new heatmap chart type for visualizing data where values are represented as colors. Heatmaps require exactly two dimensions and one metric, making them perfect for showing relationships between categorical dimensions.
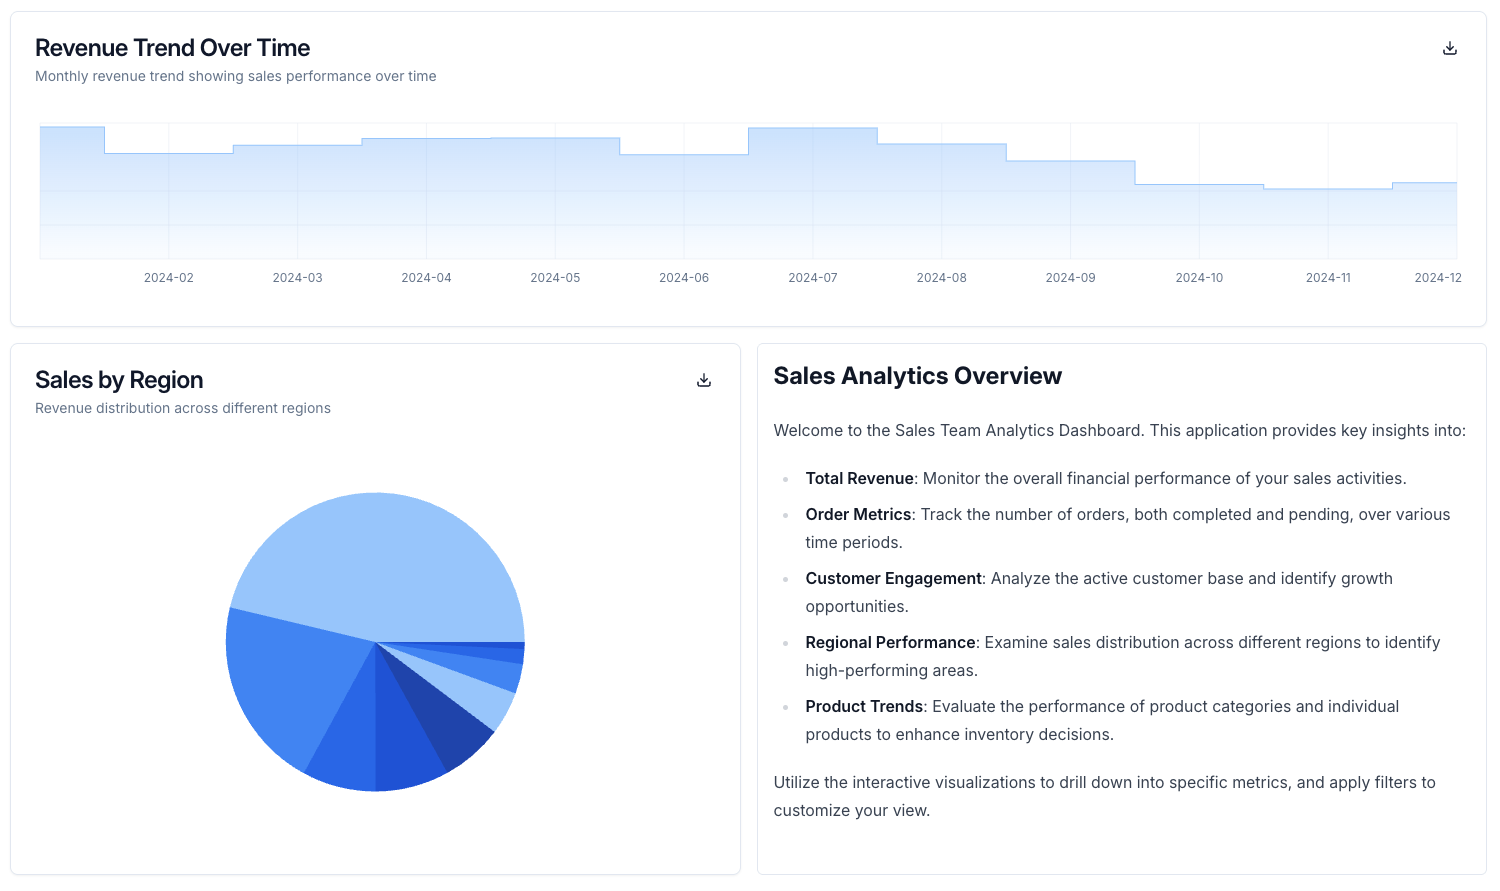
 * **[Markdown Component](reference/intelligent-apps/components#text-markdown)**: Added support for Markdown components in Intelligent Apps. Users can now add rich text sections with formatting, headers, lists, and more to their dashboards.
 * **[Multiple Selection Filters](reference/intelligent-apps/filters#handling-multiple-selection-filters)**: Enhanced dropdown filters with multiple selection capability. Users can now select multiple values from a dropdown filter, with proper handling in SQL queries using Jinja templates.
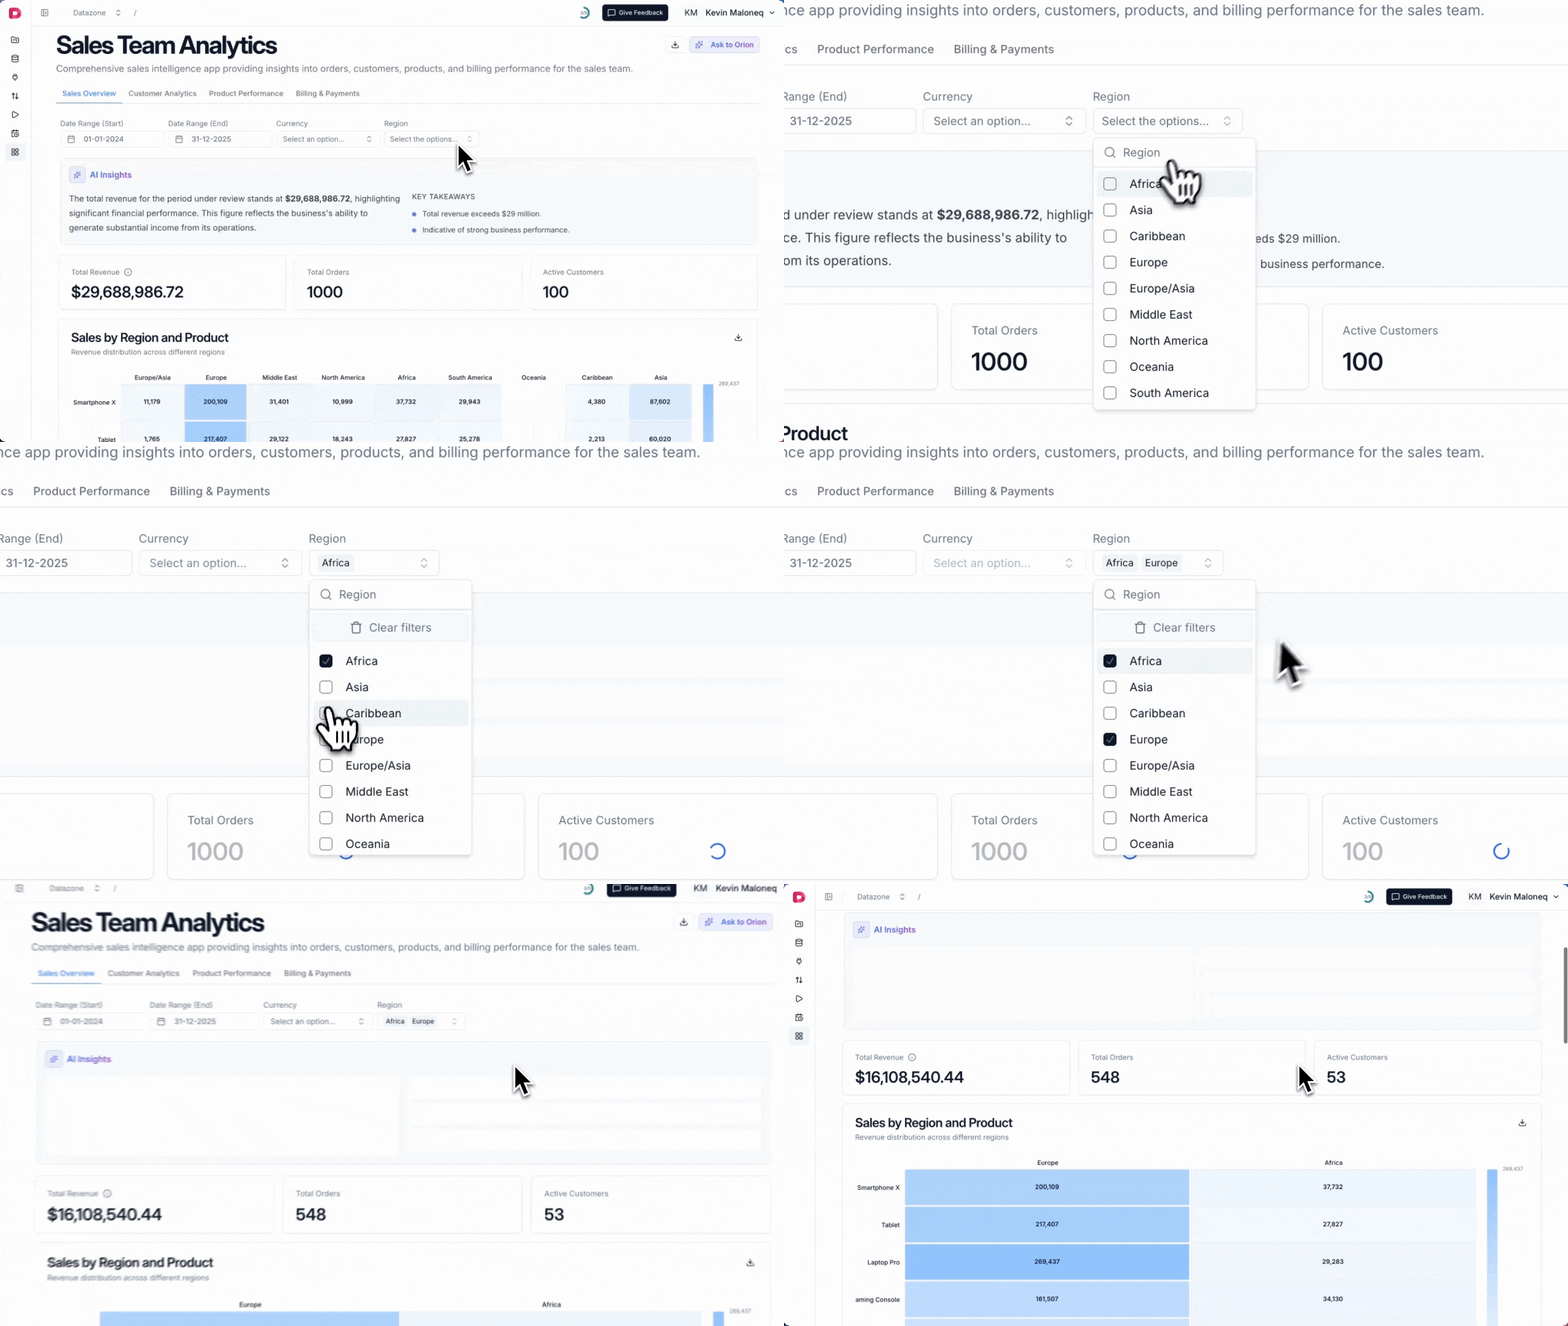
 * **[Embedded Intelligent Apps](reference/intelligent-apps/embedding)**: Introduced the ability to embed Intelligent Apps into external applications via iframes. Generate a secure JWT token containing app and user details, and easily integrate dashboards into your own products.
* **[Theme selection for Intelligent Apps](reference/intelligent-apps/yaml-reference#style-configuration)**: Added theme customization options for Intelligent Apps with multiple color schemes: default, teal, blue, green, purple, orange, amber, and mono. Set themes through the `style.theme` configuration property.
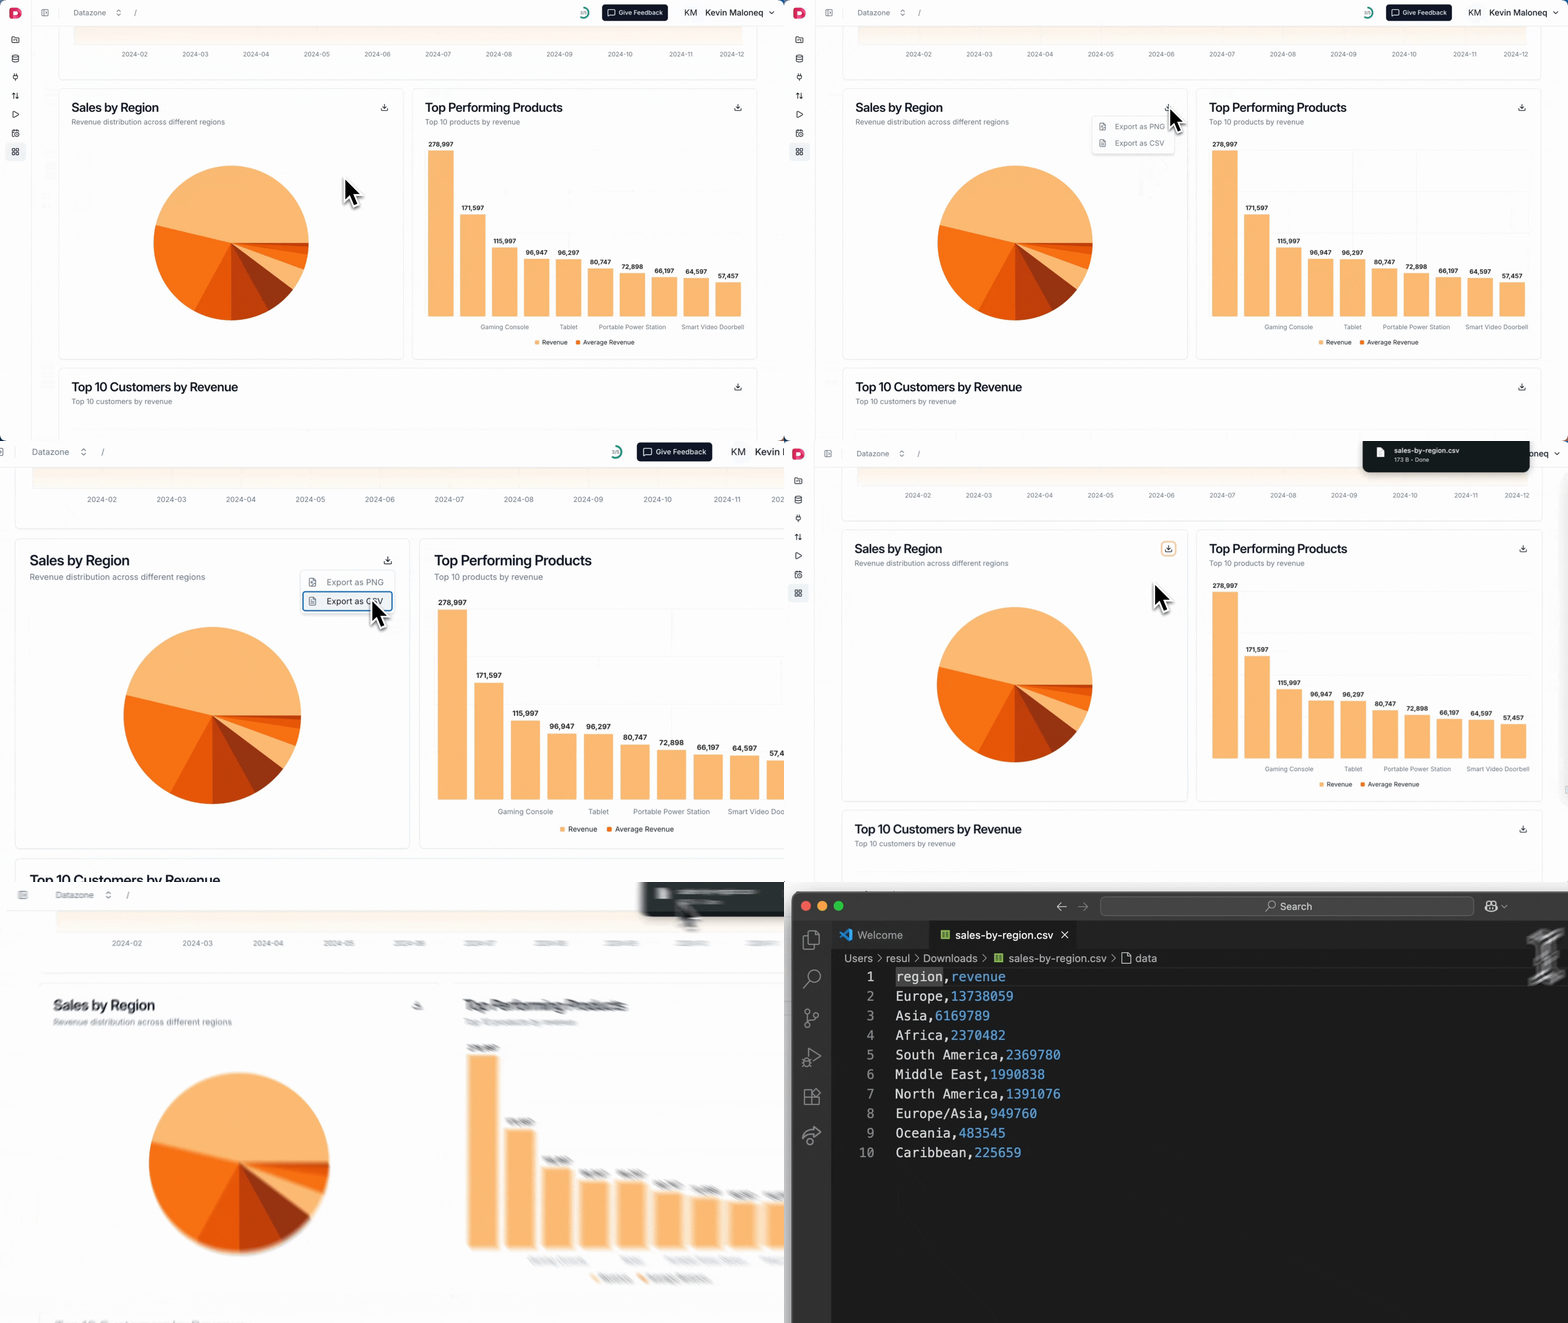
* **[Chart export features](reference/intelligent-apps/yaml-reference#config-section)**: Added export capabilities for Intelligent App charts. Users can now download chart data as CSV files or save visualizations as PNG images. Enable with the `chart_export_enabled` configuration property.
* **[Embedded Intelligent Apps](reference/intelligent-apps/embedding)**: Introduced the ability to embed Intelligent Apps into external applications via iframes. Generate a secure JWT token containing app and user details, and easily integrate dashboards into your own products.
* **[Theme selection for Intelligent Apps](reference/intelligent-apps/yaml-reference#style-configuration)**: Added theme customization options for Intelligent Apps with multiple color schemes: default, teal, blue, green, purple, orange, amber, and mono. Set themes through the `style.theme` configuration property.
* **[Chart export features](reference/intelligent-apps/yaml-reference#config-section)**: Added export capabilities for Intelligent App charts. Users can now download chart data as CSV files or save visualizations as PNG images. Enable with the `chart_export_enabled` configuration property.
 * **[File Container](reference/development/file-container)**: Introduced File Container, a **storage solution** for managing files in Datazone. It allows you to create, update, and delete file containers, and use them to store data for your pipelines and notebooks. You can interact with file containers like AWS S3 buckets or Google Cloud Storage buckets using the `FileContainerClient` toolkit.
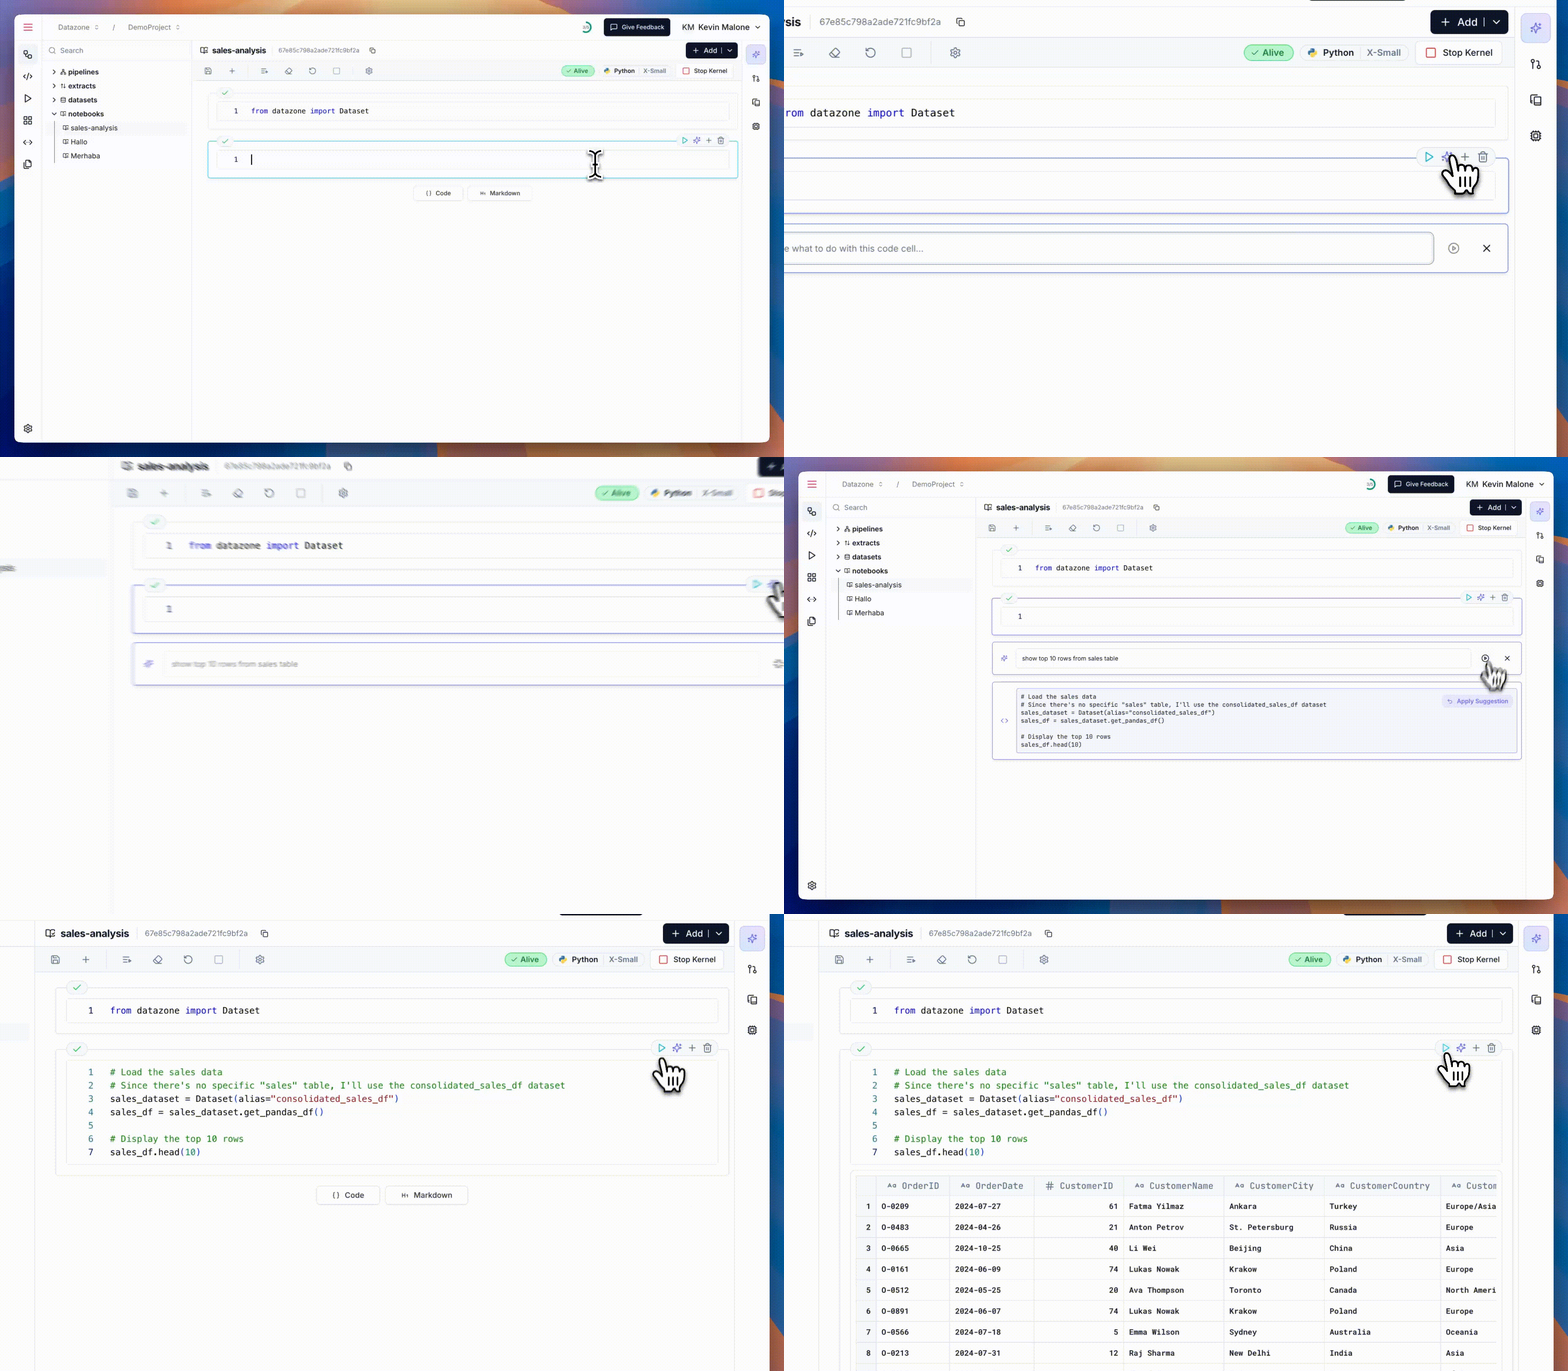
* **Orion Notebook Assistant:** Added support for **code suggestion** and **error suggestions** in Orion Notebooks. Just click to Sparkles ✨ and tell what you want to do, and Orion will suggest code snippets.
* **[File Container](reference/development/file-container)**: Introduced File Container, a **storage solution** for managing files in Datazone. It allows you to create, update, and delete file containers, and use them to store data for your pipelines and notebooks. You can interact with file containers like AWS S3 buckets or Google Cloud Storage buckets using the `FileContainerClient` toolkit.
* **Orion Notebook Assistant:** Added support for **code suggestion** and **error suggestions** in Orion Notebooks. Just click to Sparkles ✨ and tell what you want to do, and Orion will suggest code snippets.
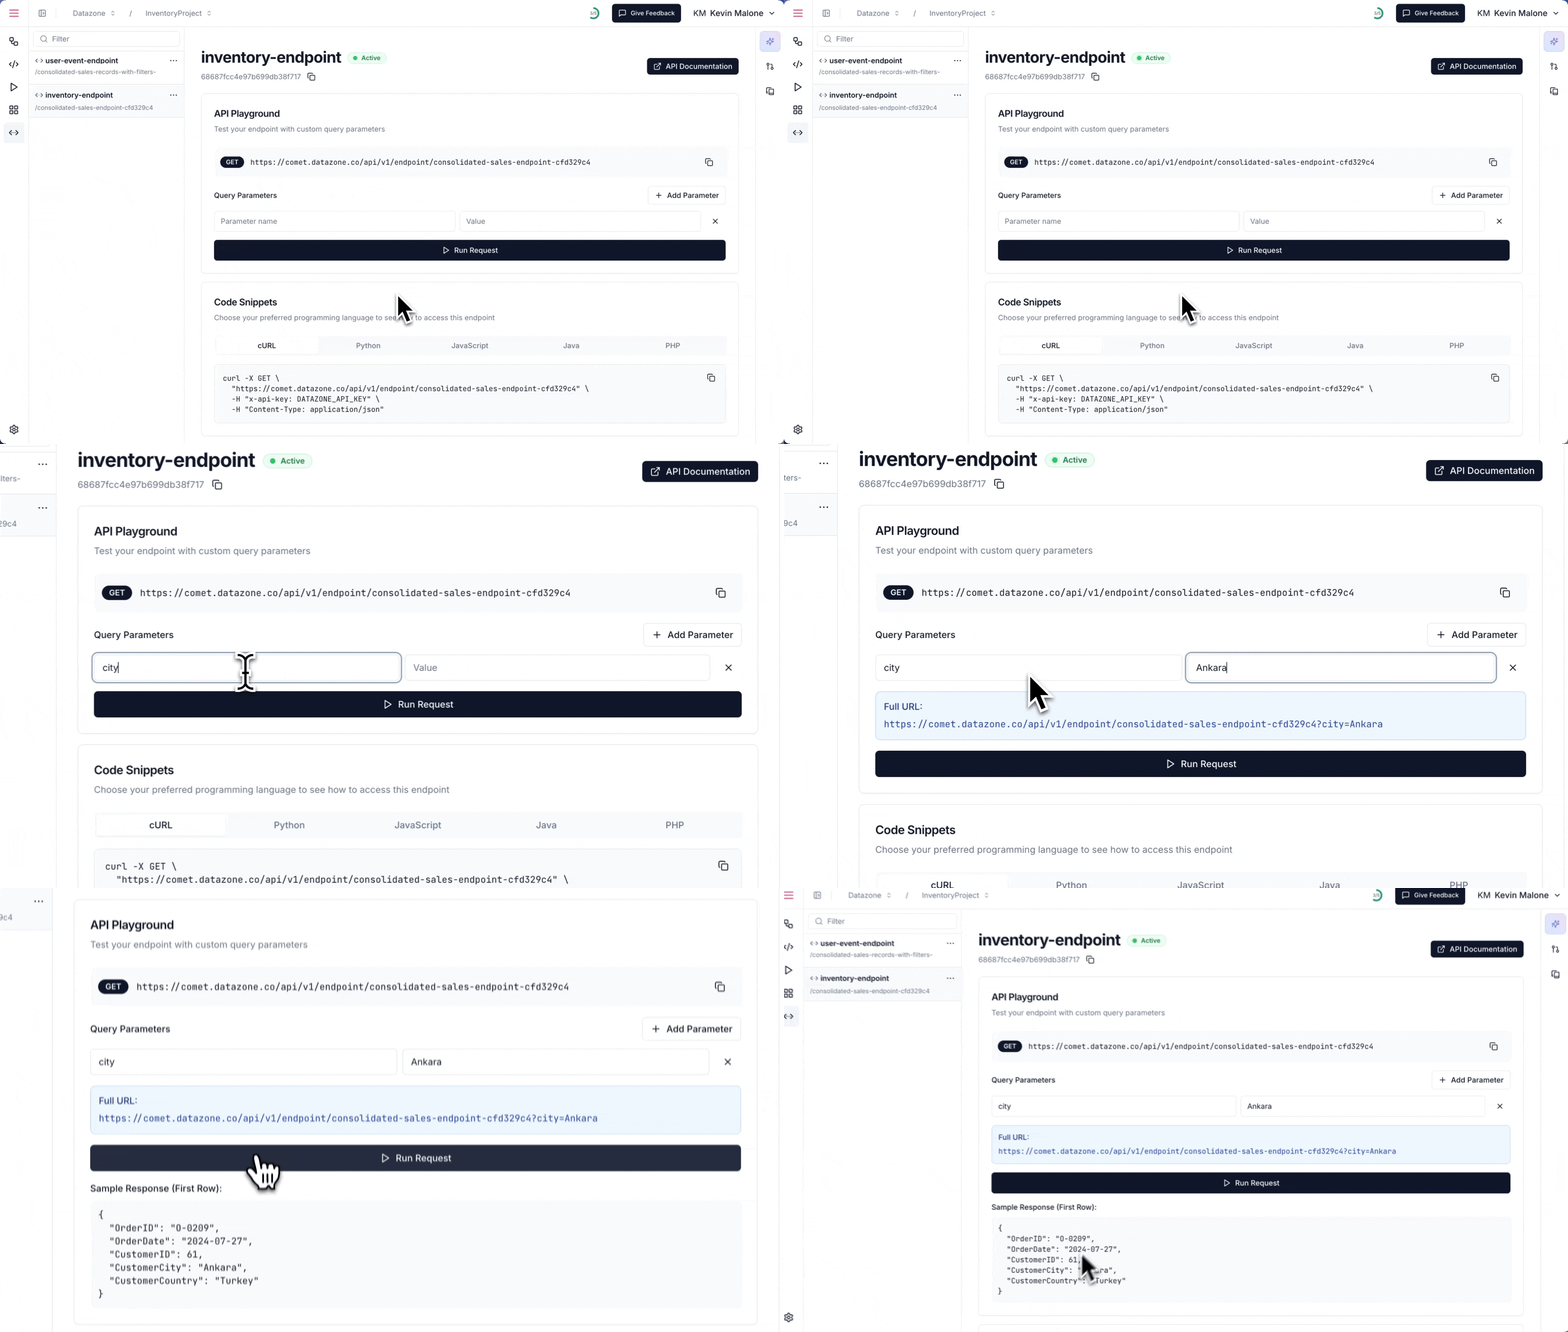
 * **[Endpoints](reference/integration/endpoints)**: Introduced a new core concept - Endpoints! Users can now create secure, controlled API interfaces for their datasets. Define endpoints using YAML configuration with filters, queries, and authentication. Perfect for exposing analytical results, feeding data to downstream systems, or creating data products that other teams can consume.
 * **[chart\_config](reference/intelligent-apps/components#chart-configuration) attribute**: The `chart_config` attribute is now available for all chart types, allowing you to customize chart appearance with options like `fill_donut`, `show_labels`, and `show_legend`.
* **[Stacked bar charts](reference/intelligent-apps/components#stacked-bar-charts)**: Added support for stacked bar charts using the `is_stacked` attribute, allowing you to visualize multiple metrics in a single bar
* **[chart\_config](reference/intelligent-apps/components#chart-configuration) attribute**: The `chart_config` attribute is now available for all chart types, allowing you to customize chart appearance with options like `fill_donut`, `show_labels`, and `show_legend`.
* **[Stacked bar charts](reference/intelligent-apps/components#stacked-bar-charts)**: Added support for stacked bar charts using the `is_stacked` attribute, allowing you to visualize multiple metrics in a single bar
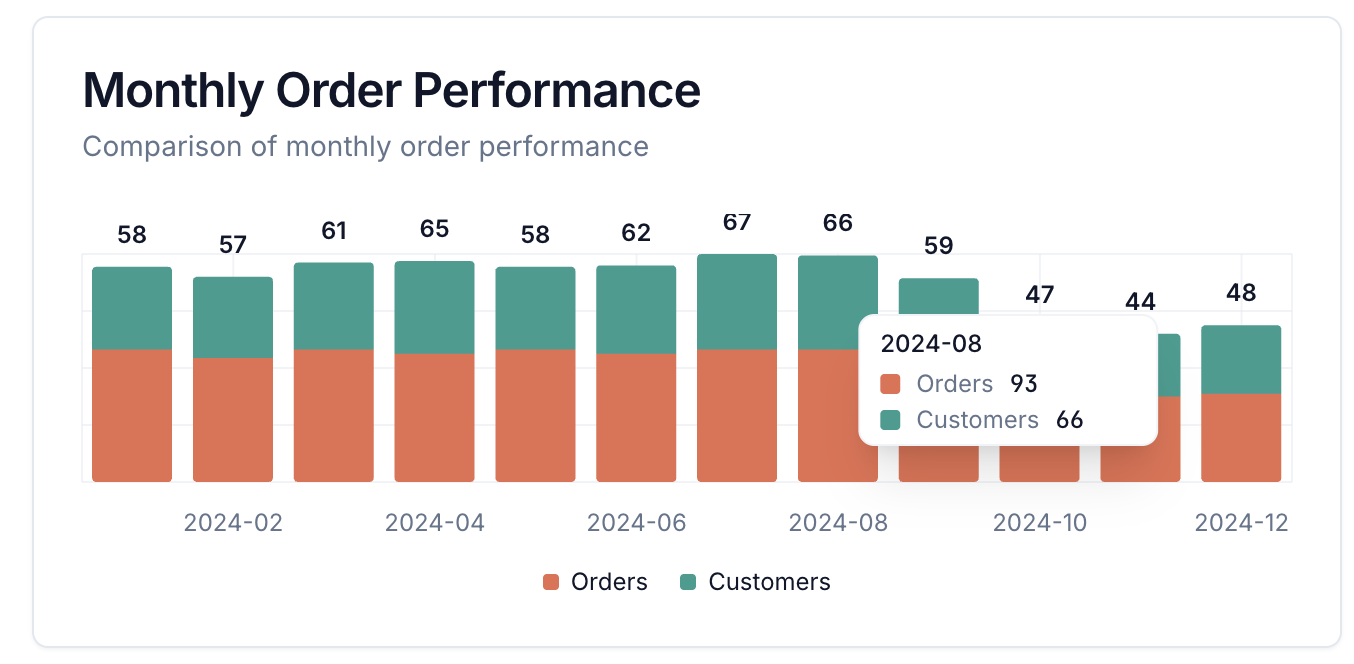 * **[fill\_donut](reference/intelligent-apps/components#chart-configuration) for pie charts**: The `fill_donut` attribute is now available for pie charts, allowing you to fill the donut area for a more visually appealing design.
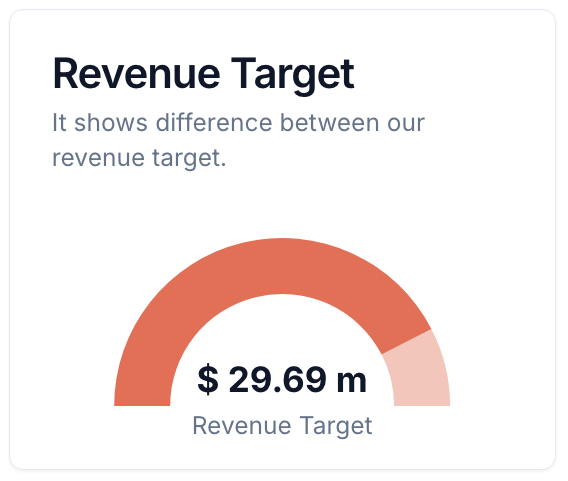
* **[Radial chart type](reference/intelligent-apps/components#radial-charts)**: Added support for the new `radial` chart type, perfect for displaying progress or completion metrics in a circular format. Requires exactly two metrics where the first represents the current value and the second represents the total.
* **[fill\_donut](reference/intelligent-apps/components#chart-configuration) for pie charts**: The `fill_donut` attribute is now available for pie charts, allowing you to fill the donut area for a more visually appealing design.
* **[Radial chart type](reference/intelligent-apps/components#radial-charts)**: Added support for the new `radial` chart type, perfect for displaying progress or completion metrics in a circular format. Requires exactly two metrics where the first represents the current value and the second represents the total.
 * **[Filter dependencies and cascading filters](reference/intelligent-apps/filters#filter-dependencies)**: Enhanced filter functionality with dependent filters that create cascading effects. Filters can now reference other filter variables in their SQL queries, enabling hierarchical filtering like country → city relationships.
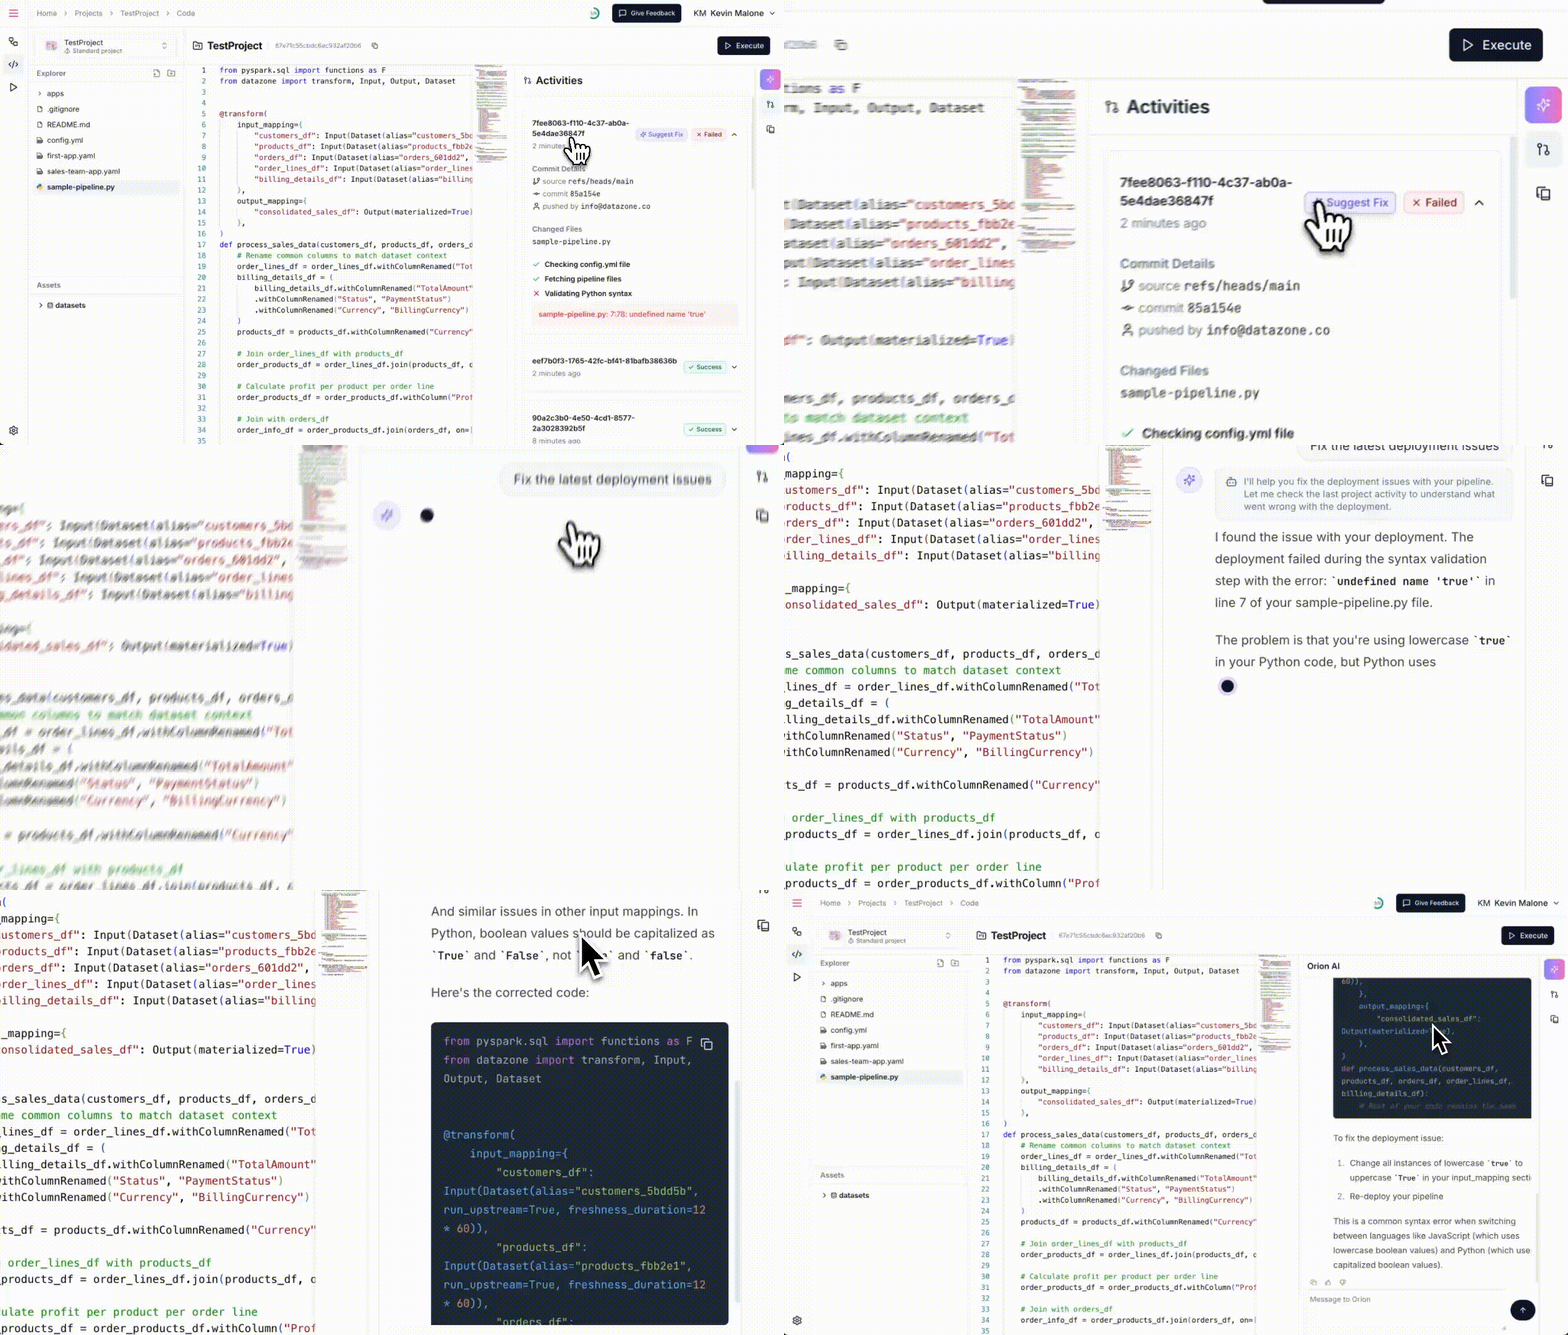
* **AI-driven deployment error assistance**: New deployment activity feature allows users to directly ask Orion Code Assistant for help when encountering deployment errors, providing intelligent troubleshooting and fix suggestions.
* **[Filter dependencies and cascading filters](reference/intelligent-apps/filters#filter-dependencies)**: Enhanced filter functionality with dependent filters that create cascading effects. Filters can now reference other filter variables in their SQL queries, enabling hierarchical filtering like country → city relationships.
* **AI-driven deployment error assistance**: New deployment activity feature allows users to directly ask Orion Code Assistant for help when encountering deployment errors, providing intelligent troubleshooting and fix suggestions.
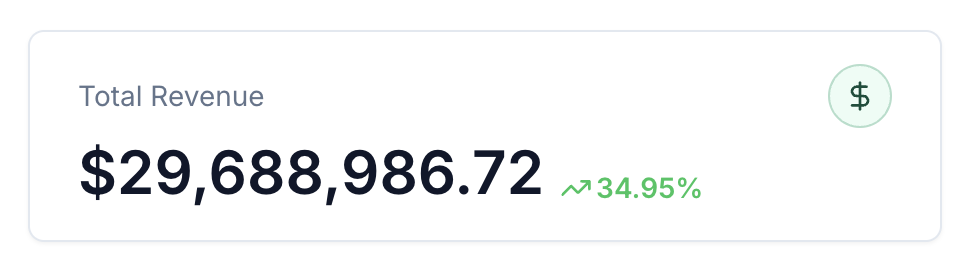
 * **[Icon feature for number charts](reference/intelligent-apps/components#number-charts)**: You can now add Lucide icons next to number values in number charts using the `icon` and `icon_variant` attributes.
 * **[metric\_format to format](reference/intelligent-apps/yaml-reference#charts)**: The `metric_format` attribute is deprecated. Use the new `format` attribute under each metric instead.
* **[Composed (combined) chart type](reference/intelligent-apps/components#composed-charts)**: Added support for the new `composed` chart type, allowing you to combine line and bar series in a single chart.
* **[metric\_format to format](reference/intelligent-apps/yaml-reference#charts)**: The `metric_format` attribute is deprecated. Use the new `format` attribute under each metric instead.
* **[Composed (combined) chart type](reference/intelligent-apps/components#composed-charts)**: Added support for the new `composed` chart type, allowing you to combine line and bar series in a single chart.
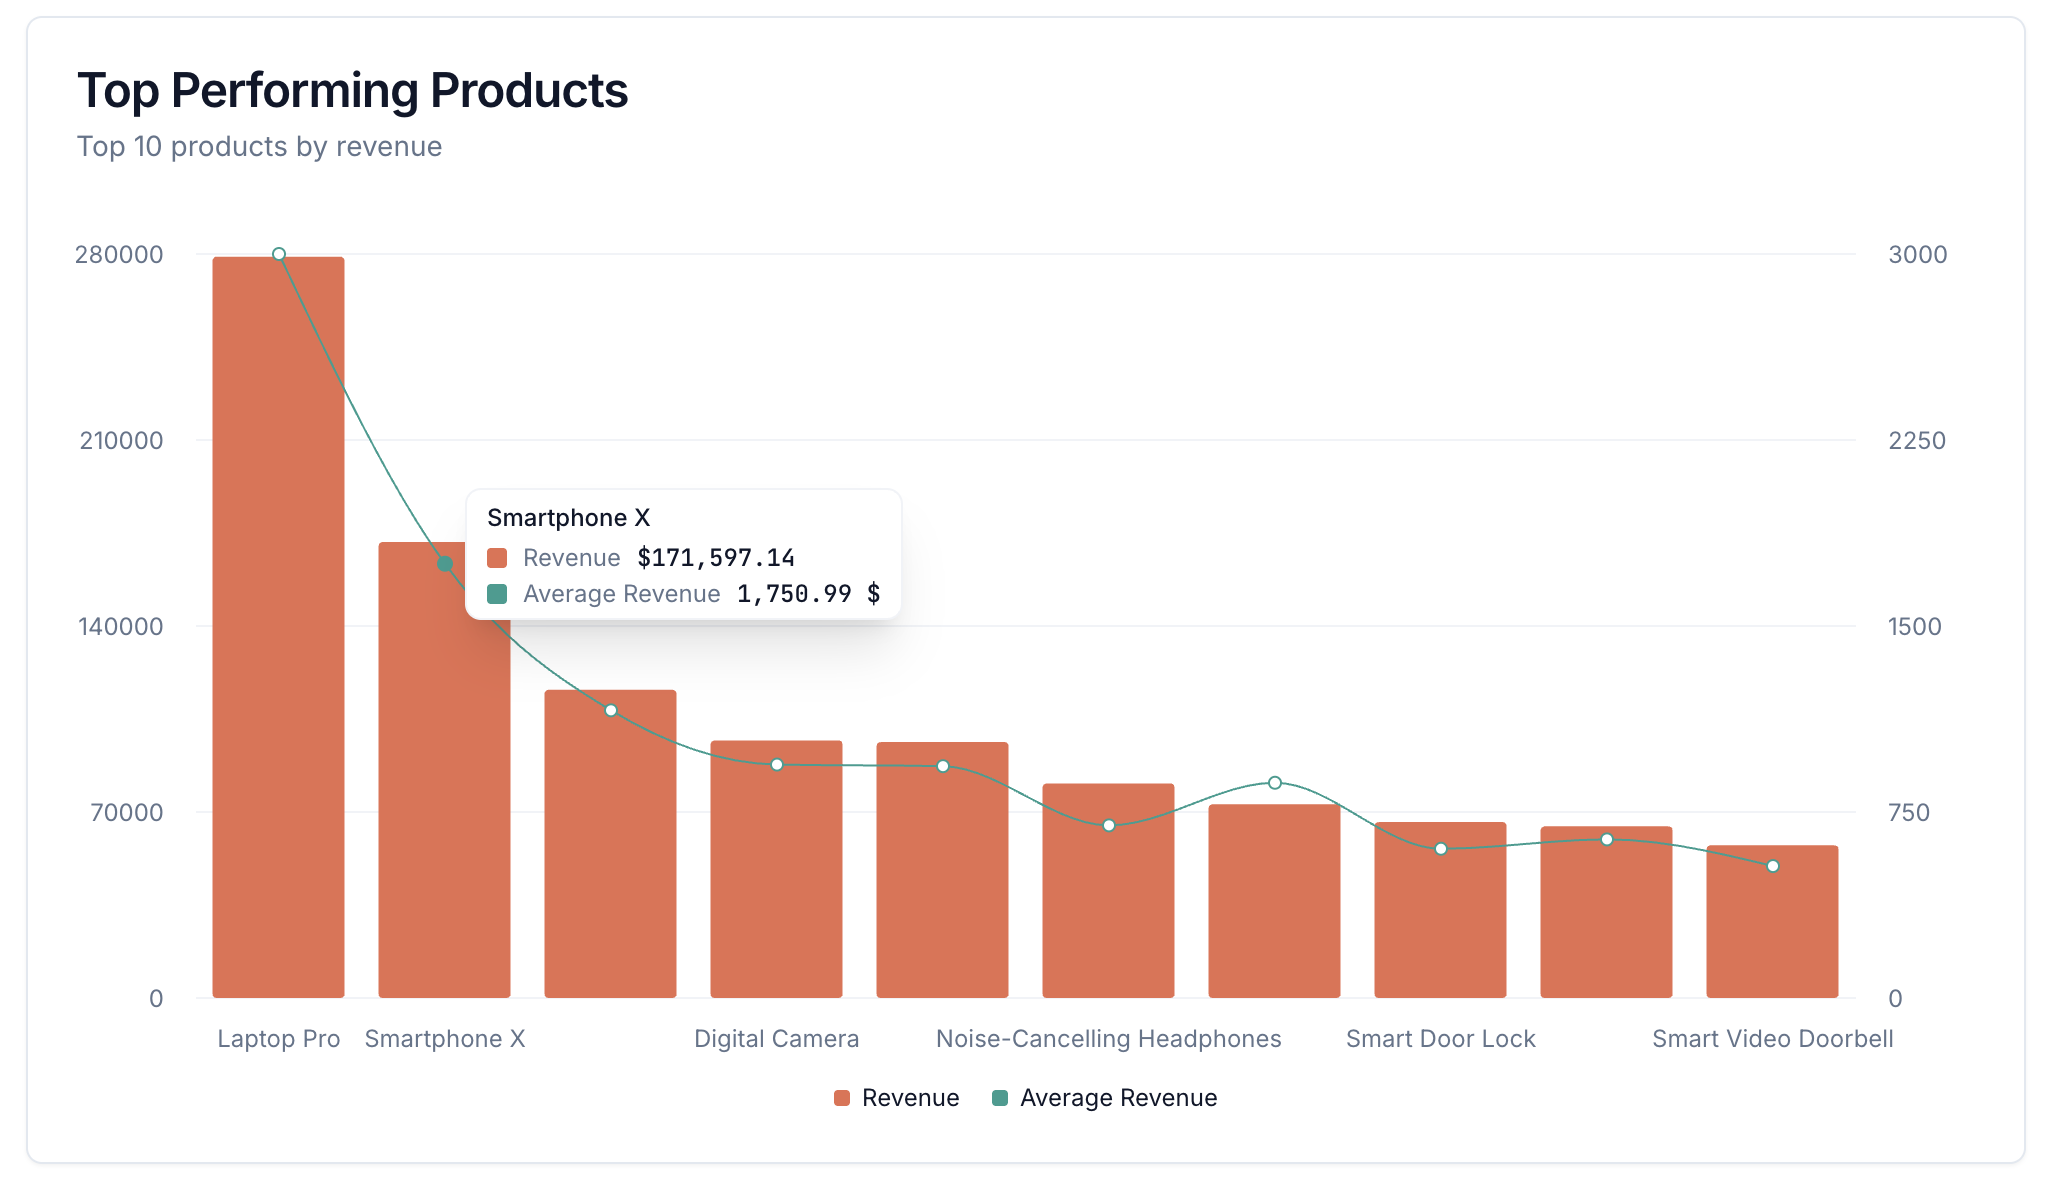 * **[Axis support for line, bar, and composed charts](reference/intelligent-apps/components#axis)**: You can now define multiple axes using the `axis` property and assign metrics to axes with `axis_name`.
* **[affected\_filter for bar and pie charts](reference/intelligent-apps/components#bar-charts)**: Add `affected_filter` under a dimension to allow users to update filter values by clicking chart items (bars or pie slices).
* **[Axis support for line, bar, and composed charts](reference/intelligent-apps/components#axis)**: You can now define multiple axes using the `axis` property and assign metrics to axes with `axis_name`.
* **[affected\_filter for bar and pie charts](reference/intelligent-apps/components#bar-charts)**: Add `affected_filter` under a dimension to allow users to update filter values by clicking chart items (bars or pie slices).